Previous Chapter « Table of Contents » Next Chapter
Some basic rules about monitoring the function of wildlife crossings and assessing their conservation value were provided in Forman et al. (2003). The criteria used to measure their function or conservation value, however, will depend on the intended purpose of the wildlife crossings, the taxa of interest and the biological level of organization most relevant to monitoring and research goals.
Monitoring needs to be an integral part of a highway mitigation project, even long after the measures have been in place. Mitigation is costly, generally requiring a large investment of public funds. Post-construction evaluations are not only necessary but also a judicious use of public infrastructure funds and can help agencies save money in future projects (see Adaptive Management below).
Monitoring and research can range from a simple, single-species population within the highway corridor to more complex ecological processes and functions within regional landscapes of conservation importance.
Wildlife crossing structures are, in essence, site-specific movement corridors strategically placed over highways that bisect important wildlife habitat as Figure 28 shows. Like wildlife corridors, crossing structures should allow for the following five biological functions:
These functions encompass three levels of biological organization - genes, species/population, community/ecosystem - which form the basis for developing natural resource management and conservation plans.
From these five functions it is possible to set performance objectives, determine best methods to monitor, develop study designs, and resolve the management questions associated with the project objectives.
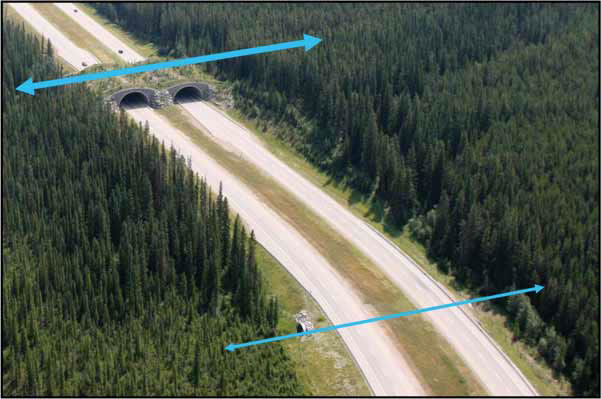
Figure 28. Photo. Crossing structures are site-specific movement corridors that link wildlife habitat separated by pavement and high-speed vehicles (Credit: Jeff Stetz).
Note that these functions increase both in complexity and in the cost and time required to properly monitor whether they are being facilitated as shown in Table 6. Not all ecological functions may be of management concern for transportation agencies, particularly those at the more complex end of the scale; however, they will be of concern for land and natural resource management agencies.
Simple and low-cost techniques using remote cameras can be used to detect animals using wildlife crossing structures, i.e., level 1 - genes. However, information about numbers of distinct individuals, their gender and genetic relationships cannot be reliably obtained using remote cameras.
A non-invasive genetic sampling method was used to assess population-level benefits (level 2 - species/populations, Table 6) of 20 wildlife crossings on the Trans-Canada Highway in Banff National Park, Alberta (see Appendix E, Figures 78 and 79; Clevenger and Sawaya 2009).
LEVELS OF BIOLOGICAL ORGANIZATION AND ROAD IMPACTS
A recent U.S. National Academies report on assessing and managing the impacts of roads recommended using the three levels of biological organization as a framework to design future research to assess the ecological effects of paved roads (NRC 2005).
| Level | Ecosystem Function (simple to complex) | Level of Biological Organizationa | Level of Connectivityb | Cost and Duration of Researchc |
|---|---|---|---|---|
| 1a | Movement within populations and genetic interchange | Genetic | Genetic | Low cost - Short term |
| 1b | Reduced mortality due to roads | Genetic & Species/population | Genetic & Species/population | Low cost - Short term |
| 2 | Ensure that the biological requirements of finding food, cover and mates | Species/population | Demographic | Moderate-to- High cost - Long term |
| 3 | Dispersal from maternal ranges and recolonization after long absences | Species/population | Functional | Moderate-to- High cost - Long term |
| 4 | Populations to move in response to environmental changes and natural disasters; | Ecosystem/community | Functional | High cost - Long term |
| 5 | Long term maintenance of metapopulations, community stability, and ecosystem processes | Ecosystem/community | Functional | High cost - Long term |
a See Noss 1990, Redford and Richter 1999.
b Genetic: Predominantly adult male movement across road barriers; Demographic: Genetic connectivity with confirmed adult female movement across road barriers; Functional: Genetic and demographic connectivity with confirmed dispersal of young females that survive and reproduce.
c Based on studies of large mammals. Cost and duration will largely be dependent upon area requirements, population densities, and demographics.
Roads and traffic affect wildlife at multiple levels of biological organization: therefore different management questions require different types of research and mitigation measures. Certain questions can be "big" or general and may require answers from multiple scales and perspectives. However, big picture research is not necessarily general in nature. General principles have to be well founded, and they are often based on thorough studies of the life histories of wildlife species.
This hierarchical approach covers the entire biological spectrum from genes on up to higher levels of communities and ecosystems. It is well suited to answering most transportation and natural resource agency management needs of reducing road impacts on wildlife populations. It can provide guidelines and decision support regarding the monitoring and evaluation of wildlife crossings.
Another value of the hierarchy approach is the recognition that effects of roads and traffic can reverberate through other levels, often in unpredictable ways, as secondary and cumulative effects. Specific indicators can be identified at multiple levels of organization to monitor and assess the performance of mitigation designed to reduce road-related mortality, and restore movements and interchange within populations.
The guidelines below are designed for monitoring plans evaluating the conservation value and efficacy of wildlife crossings. This framework can be used to formulate management questions, select methodologies, and design studies to measure performance of wildlife crossings in mitigating road impacts.
Before starting a monitoring program, specific benchmarks and thresholds should be agreed upon that trigger management actions. For example, >50% reduction in road-kill would be acceptable, but <50% reduction would trigger additional management actions to improve mitigation performance. Normally a power analysis is also performed to determine if these reductions can actually be detected (see below).
Few studies have rigorously monitored and researched the performance of highway mitigation measures using study designs with high inferential strength. For some agencies, monitoring has not been a priority, much less research - if circumstantial evidence suggested that animals appeared to use wildlife crossings, then they were deemed effective.
One of the difficulties in developing performance targets is agreeing on what defines a "reduction" in wildlife - vehicle collisions and an "increase" in landscape connectivity or animal movements across a highway. Transportation agencies tend to have relatively relaxed targets or expectations for how well crossing structures perform. In contrast, resource and land management agencies generally require more science-based evidence that wildlife crossings or other measures result in positive changes to wildlife movements and regional population connectivity.
A decrease in road-related mortality and an increase in the frequency of highway crossings by focal species may generally be considered performance targets for mitigation efforts. Broad definitions such as these can be used to measure the effectiveness of mitigation measures and whether targets are being met.
However, properly designed monitoring programs with research-specific study designs and predefined performance targets will have the greatest ability to evaluate whether mitigation efforts are meeting their targets (Appendix D).
The lead agency and other stakeholders need to know how their mitigation investment dollars are being spent and how the technology can be transferred to future projects. Taxpayers will also want to know whether the measures are effective.
Targets designed to evaluate whether the amount of observed change is acceptable should be determined a priori by the transportation agency responsible for the project with the concerns of the natural resource management agency and other project stakeholders in mind. The agreed-upon targets need to be scientifically defensible. Without specific targets and a means to track performance, transportation and resource management agencies can come under scrutiny for not having objectively defined targets or performance standards.
Because landscape conditions and population dynamics vary over time, short- and long-term monitoring and performance targets should be assessed periodically and readjusted accordingly.
All species from a project area cannot be monitored. The selection of focal species should result in monitoring data that will be most relevant to either the greatest number of species in the area, or to those species that are the most sensitive to the process being monitored, e.g., ability to cross highways. Table 7 provides some criteria to help guide the selection of focal species.
Selected focal species are indicators of changes - positive or negative - that result from efforts to mitigate road impacts in the project corridor.
The selected survey methods should permit the collection of data from a large number of species - e.g., most medium and large mammals. Rigorous evaluation of these data will, however, be limited to those species that generate sufficient amounts of data for statistical analyses and inference. In these cases, focal species will not be identified until pre-mitigation population surveys have begun or pilot data is collected in the project area.
Another consideration is how monitoring focal species can translate into direct management benefits and support from outside the project as shown in Table 7. Some wildlife species may resonate with the public and information about them may help generate support for the project. While this is a secondary criterion, it is important to consider in the selection process.
| 1. Monitoring | |
|---|---|
| Primary Criteria | |
| Ecological Attributes | Which focal species will serve as the best indicators of change and maintenance of ecological processes? |
| Sample Size Requirements | Which focal species will provide large enough datasets to permit sufficiently accurate and precise analyses for the monitoring needs? |
| Secondary Criteria | |
| Benefits to Management | Will the information acquired from monitoring the selected focal species provide benefits to (a) local management (e.g., DOT, land management agency) and/or (b) management elsewhere, such that it will have broader research application (e.g., significant contribution to knowledge base and science of road ecology)? |
| Public Profile and Support | Is at least a subset of the selected focal species high-profile and charismatic such that they resonate with the general public and help to gain public and private support for the project (e.g., cougar, wolverine)? |
| 2. Ecosystem Context | |
| Taxonomic Diversity | Do the selected focal species represent a diversity of taxonomic groups? |
| Levels of Biological Organization (see Noss 1990) | Do the selected focal species provide information suitable for addressing questions aimed at the first two levels of biological organization (genes/individuals, species/populations)? |
Monitoring information must be of value at the project level, as managers are interested in project-specific applications. However, some results will have management benefits beyond the project area boundaries and have national or international significance in advancing knowledge of wildlife crossing mitigation. Attempts should be made to choose focal species and management questions that have impacts at the project and national or international scale.
After identifying suitable focal species, a second consideration relates to how well the focal species fit within an ecosystem context. For each of the management questions it will be important to maximize the taxonomic diversity represented in the suite of focal species, e.g., amphibians, reptiles, small to large mammals. Road effects on wildlife populations are scale- specific, and such an approach will, therefore, help to ensure that some of the more important scale-related issues (spatial and temporal) of the investigation are adequately addressed.
There are a variety of wildlife survey methods available today. These methods range from the relatively simple (reporting of wildlife - vehicle collisions by transportation agency personnel) to the complex (capture and global positioning system [GPS] collaring of individual animals). Whatever the monitoring objective and focal species, the selection of appropriate survey methods is critically important as Table 8 shows.
In some cases multiple methods exist for a given objective - species combination and researchers will have the luxury of balancing cost with specific data requirements and available funding or personnel.
For some methods, most costs occur at the onset of monitoring efforts (e.g., purchase of remote cameras), whereas for others the costs are largely distributed throughout the monitoring period (e.g., snow tracking).
Appendix E describes many methods that can be used to meet a number of basic monitoring objectives. Decisions as to the best methods must be made based on the particular objective, focal species, season, cost, and location.
| Monitoring purpose | Available monitoring methods | Timing | Target species | Check frequency | Area of use | Estimated cost | Cost loading |
|---|---|---|---|---|---|---|---|
| Assess wildlife - vehicle collision rate | |||||||
| Carcass removal by maintenance crews and natural resource agency staff |
Pre; post | Elk, deer, black bear and other large species when possible | As occurs | Median/right-of- way | Low | Continuous | |
| Wildlife - vehicle collision reports by highway patrol |
Pre; post | Elk, deer, black bear and other large species when possible |
As occurs | Median/right-of- way | Low | Continuous | |
| Systematic driving surveys | Pre; post | Medium to large mammals | 1 - 7 days | Median/right-of- way | High | Continuous | |
| Assess use/effectiveness of wildlife crossing structures (existing and proposed) |
|||||||
| Remote still cameras or video | Pre; post | Medium to large mammals | Weekly | Wildlife crossings/Culverts | Medium | Front-loaded | |
| Track beds | Pre; post | Medium to large mammals | 1 - 3 days | Wildlife crossings/Dry culverts |
Medium | Continuous | |
| Unenclosed track plates | Pre; post | Medium to large mammals | 1 - 3 days | Wildlife crossings/Dry culverts | Medium | Continuous | |
| Enclosed track plates | Pre; post | Smaller mammals | 1 - 3 days | Small dry culverts | Medium | Continuous | |
| Hair collection devices with DNA methods |
Pre; post | Select medium to large mammals |
3 - 5 days | Wildlife crossings/Culverts | Medium to high* | Continuous and end-loaded | |
| Trap, tag, and recapture/ resight | Pre; post | Amphibians, reptiles, small mammals | Select times | Ponds and water bodies within or adjacent to highway | Low | Continuous | |
| GPS collaring | Pre; post | medium to large mammals | Select times | Within animal home range | High | Front-loaded | |
| Assess rate of at-grade highway crossings by wildlife | |||||||
| Remote still cameras or video (deployed randomly) |
Pre** | Medium to large mammals | Weekly | Right-of-way | Medium to high | Front-loaded | |
| Remote still cameras or video (deployed at targeted locations) |
Pre** | Medium to large mammals | Weekly | Right-of-way | Medium to high | Front-loaded | |
| Track beds (deployed randomly) | Pre** | Medium to large mammals | 1 - 3 days | Right-of-way | Medium to high | Continuous | |
| Track beds (deployed at targeted locations) | Pre** | Medium to large mammals | 1 - 3 days | Right-of-way | Medium to high | continuous | |
| Snow track transects | Pre** | Medium to large mammals active in winter |
3 - 5 times per winter*** | Right-of-way | Medium | continuous | |
| GPS collaring | Pre; post | medium to large mammals | Select times | Within animal home range | High | Front-loaded | |
| Monitor wildlife use of locations throughout and adjacent to the project area | |||||||
| Remote still cameras or video at scent stations |
Pre; post | Medium to large mammals | Weekly | Within 1 mile of highway | Medium | Front-loaded | |
| Track plots or track plates at scent stations |
Pre; post | Small to large mammals | 1 - 3 days | Within 1 mile of highway | Medium | continuous | |
| Hair collection devices with DNA methods | Pre; post | Small group of targeted species | 3 days | Within 1 mile of highway | Low to high* | Continuous and end-loaded | |
| Snow tracking | Pre; post | Medium and large mammals active in winter | 3 - 5 times/winter |
Within 1 mile of highway | Medium | Continuous | |
| Scat detection dogs with DNA methods |
Pre; post | 3-4 targeted mammals | 1 full season | Within 1 mile of highway | Medium to high* | Front-loaded | |
| Trap, tag, and recapture/ resight | Pre; post | Amphibians, reptiles, small mammals | Select times | Ponds and water bodies within or adjacent to highway | Low | Continuous | |
| GPS collaring | Pre; post | medium to large mammals | Select times | Within animal home range | High | Front-loaded | |
| Evaluate effectiveness of wildlife fencing | |||||||
| Highway maintenance crews report animals inside fencing |
Post | Medium to large mammals | As occurs | Median/right-of- way | Medium | Continuous | |
| Highway patrol report animals inside fencing |
Post | Medium to large mammals | As occurs | Median/right-of- way | Medium | Continuous | |
| Systematic checks of fence integrity | Post | Medium to large mammals | Monthly | Fenceline | Medium | Continuous | |
| GPS collaring | Pre; post | medium to large mammals | Select times | Within animal home range | High | Front-loaded | |
| Evaluate effectiveness of jump-outs | |||||||
| Remote still cameras or video |
Post | Medium to large mammals | Weekly | Jump-outs | Medium | Front-loaded | |
| Track beds on top of jump- outs | Post | Medium to large mammals | 1 - 3 days | Jump-outs | Medium | Continuous | |
| * Cost depends largely on objectives - species-specific identification via DNA methods costs less than individual identification. Both can be cost effective when compared with more labor-intensive methods. ** Although these methods can be used to monitor post-construction, it is assumed that wildlife fencing will so dramatically reduce at-grade highway crossing attempts as to make monitoring unnecessary and extremely cost-ineffective. *** Will depend on statistical power considerations, number and timing of snow events, and time constraints. |
|||||||
CAMERA VS. TRACK-PAD MONITORING
A recent paper compared the overall efficiency of wildlife monitoring activity using track pads and motion-sensitive cameras, based on the estimated number of detections by each method (Ford et al. 2009). Mammals coyote-sized and larger were used in the analysis. Cameras outperformed track pads by most performance metrics. The only instances where track pads were preferred were at sites where security (e.g., high risk of theft or vandalism) was a concern. One of the most important factors limiting the use of track pads is the frequency of field visits required. Monitoring based on track pads needs to keep the checking intervals short enough to minimize trampling of tracks and loss of data. Increasing the frequency of visits to each site becomes more costly for the project.
ADAPTATION PERIODS
Monitoring of wildlife crossing structures has shown that an adaptation period and learning curve does exist. The few studies that have obtained more than two years of monitoring data showed that animals require an adaptation period that varies in length between ungulates and carnivores. Most monitoring efforts do not sample for sufficient duration to adequately assess how wildlife utilize crossing structures because they don't give them enough time to adapt to the structures and the changes made to the surrounding habitat where they reside. Small sampling windows, typical of one- or two-year monitoring programs, are too brief, can provide spurious results and do not adequately sample the range of variability in a species' wildlife crossing structure use patterns in landscapes with complex wildlife - human interactions.
Inferential strength in the context of mitigation monitoring is the ability to accurately evaluate whether mitigation efforts have achieved their desired effect. Maximizing inferential strength depends both on the ability to minimize confounding effects and to maximize statistical power.
Monitoring designs with low inferential strength lead to situations where researchers either detect an effect that is not actually there (a Type I error) or fail to detect an effect that is actually present (a Type II error). Minimizing the likelihood of making either type of error is of critical importance to transportation managers and researchers if they are to reliably demonstrate that mitigation measures are effective.
Roedenbeck et al. (2007) addressed this subject by identifying relevant research questions in road ecology today, recommending experimental designs that maximize inferential strength, and giving examples of such experiments for each of five research questions.
There are several types of study designs for evaluating how well mitigation measures perform.
One design consists of measuring and comparing impacted areas (I) with non-impacted areas or control sites (C) and assessing how some variable of interest behaves before (B) and after (A) a management intervention such as highway construction or mitigation. In this "BACI" design, if the difference between the control and impact (often referred to as "treatment") site is greater after intervention than before, then there is strong evidence that intervention has had a causal effect.
To increase inferential strength BACI designs should sample at more than one paired treatment + control site. Locating suitable control sites unaffected by roads can be a challenge, particularly when studying impacts on wide-ranging large mammals.
Of lower inferential strength than BACI is the before and after impact (BA) design. This requires sampling one site and evaluating how some environmental variable behaves before and after the impact. The impact could also be some form of management intervention, such as the implementation of mitigation measures. The BA design at one site can demonstrate that the environmental variable changed over time, but it cannot exclude the possibility that change was caused by some reason other than the observed impact.
A third approach compares impacted (I) sites with control (C) sites (those that are non-impacted) using a CI design. Data are only collected or made available for the period after intervention or mitigation. The inference is that if the control and impact sites differ in some environmental variable of concern, this difference is, at least in part, due to the intervention. This inference is valid only if control and impact sites would be identical in the absence of intervention.
The study design options described run from high to low inferential strength: BACI, BA, and CI. The key monitoring and research questions identified earlier are found in Appendix D. The table provides a suggested framework for designing studies to evaluate whether the general objectives of highway mitigation are being met.
Adaptive management consists of deriving benefits from measured observations from monitoring to inform decision-making with regard to planning and design of subsequent phases of a project. An example of adaptive management would be changing the design of wildlife crossing structures on subsequent phases of highway reconstruction after obtaining empirical data from the use of structures from earlier phases.
Whatever the case may be, monitoring ultimately provides management with sound data for mitigation planning, helps to streamline project planning and saves on project costs.
Regular communication and close coordination between research and management is necessary for adaptive management to be effective. This will allow for timely changes to project design plans that reflect the most current results from monitoring activities.
Beissinger, S.R., D.R. McCullough. 2002. Population viability analysis. University of Chicago Press, Chicago, Illinois, USA.
Beier, P. and R. Noss. 1998. Do habitat corridors provide connectivity? Conservation Biology 12:1241-1252.
Block, W., A. Franklin, J. Ward, J. Ganey, and G. White. 2001. Design and implementation of monitoring studies to evaluate the success of ecological restoration on wildlife. Restoration Ecology 9: 292-303.
Boitani, L. and T. K. Fuller. 2000. Research techniques in animal ecology: Controversies and consequences. Columbia University Press, New York, NY.
Chetkiewicz, C-L.B., Cassady St. Clair, C. and Boyce, M.S. 2006. Corridors for conservation: integrating pattern and process. Annual Review of Ecology and Systematics 37:317-342.
Clevenger, A.P., R. Long, R. Ament. 2008. I-90 Snoqualmie Pass East wildlife monitoring plan. Prepared for Washington State Department of Transportation, Yakima, Washington.
Clevenger, A.P., M. Sawaya. 2009. A non-invasive genetic sampling method for measuring population-level benefits of wildlife crossings for bears in Banff National Park, Alberta, Canada. Ecology and Society 15(1): 7. [online] URL: https://www.ecologyandsociety.org/vol15/iss1/art7/.
Crooks, K.R. and Sanjayan, M. 2006. Connectivity conservation. Cambridge University Press, Cambridge, UK.
Foran, D.S., K.C. Crooks, and S.C. Minta. 1997. DNA-based analysis of hair to identify species and individuals for population research and monitoring. Wildlife Society Bulletin 25 : 840- 847.
Ford, A.T., A.P. Clevenger and A. Bennett. 2009. Comparison of non-invasive methods for monitoring wildlife crossing structures on highways. Journal of Wildlife Management 73:1213-1222.
Gaines, W., R. Harrod, and J. Lehmkuhl. 1999. Monitoring biodiversity: quantification and interpretation. General Technical Report PNW-GTR-443. Portland, OR: US Dept. Agriculture, Forest Service, Pacific Northwest Research Station. 27p.
Hardy, A. A.P. Clevenger, M. Huijser & G. Neale. 2003. An overview of methods and approaches for evaluating the effectiveness of wildlife crossing structures: Emphasizing the science in applied science. Pages 319-330, in: Proceedings of the International Conference on Ecology and Transportation. Irwin, C.L., Garrett, P. McDermott, K. (eds.). Center for Transportation and the Environment, North Carolina State University, Raleigh, N.C.
Hardy, A.R., Fuller, J., Huijser, M., Kociolek, A.M. and Evans, M. 2007. Evaluation of wildlife crossing structures and fencing on US Highway 93 Evaro to Polson, phase I: preconstruction data collection and finalization of evaluation plan. FHWA/MT-06- 008/1744-1, Helena, MT. 190pp.
Lambeck, R.J. 1997. Focal species: A multi-species umbrella for nature conservation. Conservation Biology 11: 849-856.
Larson, M., F. Thompson, J. Millspaugh, W. Dijak and S. Shifly. 2004. Linking population viability, habitat suitability, and landscape simulation models for conservation planning. Ecological Modelling 180: 103-118.
Lee, K. N. 1999. Appraising adaptive management. Conservation Ecology 3 (2): 3. [online] URL: https://www.ecologyandsociety.org/vol3/iss2/art3/
Long, R. A., P. MacKay, W. J. Zielinski, and J. C. Ray, editors. 2008. Noninvasive survey methods for carnivores. Island Press, Washington D.C., USA.
MacKenzie, D.I., J.D. Nichols, J.A. Royale, K.H. Pollock, L.L. Bailey, J.E. Hines. 2006. Occupancy estimation and modeling: Inferring patterns and dynamics of species occurrence. Academic Press, New York, NY.
Margolius, R. and N. Salafsky. 1999. Measures of success: designing, managing and monitoring conservation and development projects. Island Press, Washington, DC.
National Research Council (NRC). 2005. Assessing and managing the ecological impacts of paved roads. The National Academies Press, Washington, DC.
Noss, R.F. 1990. Indicators of monitoring biodiversity: a hierarchical approach. Conservation Biology 4, 355-364.
Quinn, G.P., M.J. Keough. 2002. Experimental design and data analysis for biologists. Cambridge University Press, New York, NY.
Redford, K.H. and B.D. Richter. 1999. Conservation of biodiversity in a world of use. Conservation Biology 13, 1246-1256.
Roedenbeck, I., L. Fahrig, C. Findlay, J. Houlahan, J. Jaeger, N. Klar, S. Kramer-Schadt and E. van der Grift. 2007. The Rauischholzhausen agenda for road ecology. Ecology and Society 12 (1): 11 [online] URL: https://www.ecologyandsociety.org/vol12/iss1/art11/.
Underwood, A.J. 1997. Experiments in ecology: their logical design and interpretation using analysis of variance. Cambridge University Press, Cambridge, U.K.
Walters, C. and C.S. Holling. 1990. Large-scale management experiments and learning by doing. Ecology 71:2060-2068.
Stay up to date
Sign up for announcements on grant opportunities, training, and webinars.