

Composite Bridge Decking: Phase I Design Report
APPENDIX C: EVALUATION OF "AS-TESTED" PROPERTIES OF FRP LAMINATES
Overview
Based on earlier testing work, the researchers designed a trapezoidal profile for use in the bridge deck for this project. This profile would be produced using the pultrusion process.
The pultruded combination (combi) tube was a three-cavity trapezoid, as shown in figure 12. The part uses a fire-resistant vinyl ester resin. The reinforcement is E-glass rovings, woven mat, and CSM.
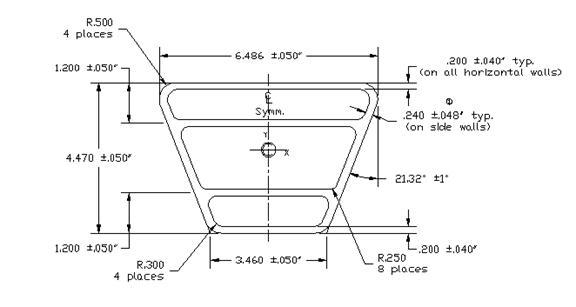
Figure 12. Diagram. Pultruded combination tube.
Figure 13 shows the laminate construction specified for the profile. The original trapezoid concept involved a constant 0.2-inch wall in all areas; however, it did not appear that adequate properties could be obtained with this concept. The final concept used a laminate of 0.2-inch horizontal walls and 0.24-inch walls for the inclined sides.
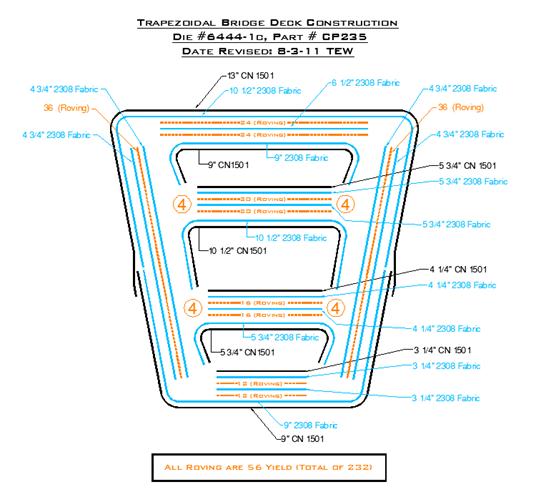
Figure 13. Diagram. Laminate construction for pultruded combination tube.
Predicted properties for this profile construction are given in table 11.
| Property | Unit | Horizontal Walls | Vertical Walls |
|---|---|---|---|
| Thickness | in | 0.2 |
0.24 |
| Fiber Volume Fraction | % | n/a |
n/a |
| Elastic Modulus – 0° (tension) | MSI | 3.39 |
3.18 |
| Elastic Modulus – 90° (tension) | MSI | 2.33 |
2.39 |
| In-Plane Shear Modulus | MSI | 0.74 |
0.75 |
| Ultimate Tensile Strength – 0° | KSI | 63.6 |
55.6 |
| Ultimate Tensile Strength – 90° | KSI | 20.6 |
22.3 |
| Ultimate Compression Strength – 0° | KSI | 54.8 |
52.6 |
| Ultimate Compression Strength – 90° | KSI | 22.3 |
23.6 |
| Ultimate Shear Strength – In Plane | KSI | 8 |
8.6 |
The individual ply details of the laminate constructions for the horizontal and vertical walls are given in tables 12 and 13.
| Material | Angle | Areal Weight, oz / yd2 | Thickness, in. |
|---|---|---|---|
| 1 ½ oz CSM | n/a |
1.5 |
0.016 |
| E-TTXM 2308 | 45 |
6.27 |
0.032 |
90 |
11.52 |
||
-45 |
6.27 |
||
CSM |
8.10 |
||
| Roving - 3.7 ends/in | 0 |
38.3 |
0.038 |
| E-TTXM 2308 | 45 |
6.27 |
0.032 |
90 |
11.52 |
||
-45 |
6.27 |
||
CSM |
8.10 |
||
| Roving - 3.7 ends/in | 0 |
38.3 |
0.038 |
| E-TTXM 2308 | 45 |
6.27 |
0.032 |
90 |
11.52 |
||
-45 |
6.27 |
||
CSM |
8.10 |
||
| 1 ½ oz CSM | n/a |
1.5 |
0.016 |
| TOTALS | 0 |
76.6 |
0.204 |
90 |
34.6 |
||
+45/-45 |
37.6 |
||
CSM |
27.3 |
| Material | Angle | Areal Weight, oz/yd2 | Thickness, in. |
|---|---|---|---|
| 1 ½ oz CSM | n/a |
1.5 |
0.017 |
| E-TTXM 2308 | 45 |
6.27 |
0.032 |
90 |
11.52 |
||
-45 |
6.27 |
||
CSM |
8.10 |
||
| E-TTXM 2308 | 45 |
6.27 |
0.032 |
90 |
11.52 |
||
-45 |
6.27 |
||
CSM |
8.10 |
||
| Roving – 7.6 ends/in | 0 |
78.6 |
0.078 |
| E-TTXM 2308 | 45 |
6.27 |
0.032 |
90 |
11.52 |
||
-45 |
6.27 |
||
CSM |
8.10 |
||
| E-TTXM 2308 | 45 |
6.27 |
0.032 |
90 |
11.52 |
||
-45 |
6.27 |
||
CSM |
8.10 |
||
| 1 ½ oz CSM | n/a |
1.5 |
0.017 |
| TOTALS | 0 |
78.6 |
0.240 |
90 |
46.1 |
||
+45/-45 |
50.2 |
||
CSM |
27.3 |
Table 14 shows a comparison of the total weights of reinforcement used in each portion of the tube profile.
| Fiber Direction | Creative Pultrusions Horizontal Wall | Creative Pultrusions Vertical Wall |
|---|---|---|
| 0 | 76.6 | 78.6 |
| 90 | 34.6 | 46.1 |
| +45/-45 | 37.6 | 50.2 |
| CSM | 27.3 | 27.3 |
| Thickness | 0.204 in. | 0.240 in. |
The bridge deck design called for a series of these trapezoidal profiles to be adhesively bonded together into a single panel unit which would form the deck. To ensure that individual units would not separate during service the bonded panel units were wrapped in an additional laminate. This outer laminate wrap also provided additional strength and stiffness to the panel.
The specified configuration of this outer wrap was two layers of Knitmat S36007G fabric with a layer of Infusamat S1815CFM fabric in between the two layers. Knitmat S36007G is a stitch-bonded biaxial fabric with 17.92 oz/yd2 of unidirectional reinforcement oriented at both 0° and 90° for a total fabric weight of 35.84 oz/yd2. Infusamat S1815CFM is a biaxial fabric with 8.96 oz/yd2 of unidirectional reinforcement oriented at both 0° and 90°. The biaxial layers are stitched to a 13.5 oz/yd2 layer of continuous filament mat (randomly oriented fiber). The fabric is designed specifically for resin infusion processes, with the continuous filament mat providing a medium to improve resin flow into reinforcement fiber during fabrication.
This appendix outlines testing conducted on these various laminates using test samples from the actual production environment. Samples of the trapezoidal tube were taken from the actual production run. The outer wrap laminates were prepared by XC Associates in their facility using production run materials and fabrication methods.
Test Methods Utilized in Characterization Work
The test methods used in this characterization are outlined in table 15. These tests yield strength and modulus values in both primary directions (denoted as 0° for the primary fiber axis and 90° for the direction normal to that axis). Properties are determined in both tension and compression. In-plane shear strength was also determined. The fiber content of each panel was also determined to allow proper comparison of the resulting properties from each laminate.
| ASTM Test No. | Title | Properties Obtained | Symbol |
|---|---|---|---|
| D3039/3039M-08 | Standard Test Method for Tensile Properties of Polymer Matrix Composites | Ultimate tensile strength (0°) | σ1T |
| Ultimate tensile strain (0°) | ε1T | ||
| Modulus of elasticity (chord) (0°) | E1T | ||
| Ultimate tensile strength (90°) | σ2T | ||
| Ultimate tensile strain (90°) | ε2T | ||
| Modulus of elasticity (chord) (90°) | E2T | ||
| D6641/D6641M-09 | Standard Test Method for Compressive Properties of Polymer Matrix Composite Materials Using a Combined Loading Compression (CLC) Test Fixture | Ultimate compression strength (0°) | s1C |
| Ultimate compression strain (0°) | e1C | ||
| Modulus of elasticity (chord) (0°) | E1C | ||
| Ultimate compression strength (90°) | s2C | ||
| Ultimate compression strain (90°) | e2C | ||
| Modulus of elasticity (chord) (90°) | E2C | ||
| D5379/D5379M-05 | Standard Test Method for Shear Properties of Composite Materials by the V-Notched Beam Method | In-plane shear strength (0-90) | τ12 |
| In-plane shear strength (90-0) | τ21 | ||
| D3171-09 | Standard Test Method for Constituent Content of Composite Materials Test Method I, Procedure G: Matrix Burnoff in a Muffle Furnace | Fiber fraction - mass | mf |
| Fiber fraction - volume | vf | ||
| D2344/D2344M-00 | Standard Test Method for Short-Beam Shear Strength of Polymer Matrix Composite Materials and Their Laminates | Short Beam Shear Strength |
Test Results
Table 16 summarizes the results obtained from the trapezoidal tube through physical testing. Predicted values from the manufacturer are provided for comparative purposes.
| Property | Combi-Tube Side Walls | Combi-Tube Horizontal Walls | |||||
|---|---|---|---|---|---|---|---|
| Tested Values | Predicted Values |
Tested Values | Predicted Values |
||||
| Mean | Std. Dev. | Mean | Mean | Std. Dev. | Mean | ||
|
Modulus Tension Compression |
ET0 ET90 EC0 EC90 |
3434 KSI 2709 KSI 4178 KSI 3377 KSI |
224 KSI 416 KSI 515 KSI 281 KSI |
3180 KSI 2390 KSI – KSI – KSI |
4092 KSI 1767 KSI 3999 KSI 4157 KSI |
526 KSI 60 KSI 382 KSI 465 KSI |
3390 KSI 2330 KSI – KSI – KSI |
| Ultimate Strength Tension Compression |
UT0 UT90 UC0 UC90 |
33.00 KSI 10.28 KSI 54.12 KSI 37.50 KSI |
2.77 KSI 3.10 KSI 7.35 KSI 1.48 KSI |
55.60 KSI 22.30 KSI 52.60 KSI 23.60 KSI |
39.96 KSI 19.88 KSI 70.00 KSI 54.73 KSI |
2.11 KSI 0.96 KSI 8.08 KSI 7.49 KSI |
63.60 KSI 20.60 KSI 54.80 KSI 22.30 KSI |
| Strain at Max.Stress Tension Compression |
ET0 ET90 EC0 EC90 |
1.01 % 0.47 % 1.49 % 1.32 % |
0.13 % 0.15 % 0.21 % 0.26 % |
– % – % – % – % |
1.07 % 1.38 % 2.06 % 1.43 % |
0.09 % 0.09 % 0.36 % 0.28 % |
% % % % |
| In Plane Shear Strength | T12 T21 |
13.79 KSI 13.45 KSI |
1.07 KSI 0.64 KSI |
8.60 KSI – KSI |
13.29 KSI 15.55 KSI |
1.01 KSI 1.11 KSI |
8.00 KSI – KSI |
| Fiber Content (%) mass | mf | 74 % 53 % |
– % – % |
72 % 51 % |
% % |
||
| Volume | |||||||
| Thickness | t | 0.24 in | 0.24 in | 0.19 in | 0.20 in | ||
Table 17 summarizes the results obtained for the outer laminate wrap used to tie the individual tubes together into a single cohesive structural unit. Three different laminates were tested for this assessment. The first is a "witness panel" of the specified laminate prepared by XC Associates in their facility. The second is a sample of actual production laminate removed from a tested sample of bridge deck. The first two panels only possess glass fiber reinforcement. The third panel includes the layer of carbon which was added into the final construction to improve the overall stiffness of an unfilled panel.
| Property | Outer Wrap - Witness Panel | outer Wrap - From Deck Panel | Final Outer Wrap with Carbon | ||||
|---|---|---|---|---|---|---|---|
| Mean | Std. Dev. | Mean | Std. Dev. | Mean | Std. Dev. | ||
| Modules | |||||||
| Tension | ETO | 2339 KSI | 92 KSI | 2337 KSI | 463 KSI | 3280 KSI | 164 KSI |
| ET90 | 2410 KSI | 205 KSI | 1588 KSI | 68 KSI | |||
| Compression | ECO | 2915 KSI | 346 KSI | 2308 KSI | 439 KSI | 3222 KSI | 325 KSI |
| EC90 | 2379 KSI | 337 KSI | 2420 KSI | 201 KSI | |||
| Ultimate Strenght | |||||||
| Tension | σTO | 36.71 KSI | 1.70 KSI | 24.61 KSI | 4.89 KSI | 50.30 KSI | 2.58 KSI |
| σT90 | 39.14 KSI | 4.31 KSI | 21.54 KSI | 1.63 KSI | |||
| Compression | σCO | 39.05 KSI | 4.23 KSI | 36.39 KSI | 4.62 KSI | 35.71 KSI | 4.18 KSI |
| σC90 | 35.46 KSI | 2.68 KSI | 36.43 KSI | 4.56 KSI | |||
| Strain at Max. Stress | |||||||
| Tension | εTO | 1.70 % | 0.12 % | 1.26 % | 0.21 % | 2.06 % | 0.11 % |
| εT90 | 1.78 % | 0.13 % | 1.89 % | 0.13 % | |||
| Compression | εCO | 1.61 % | 0.27 % | 1.87 % | 0.43 % | 1.91 % | 0.39 % |
| εC90 | 2.01 % | 0.52 % | 1.95% | 0.35% | |||
| In Plane Shear Strength | T12 | 9.51 KSI | 1.12 KSI | 9.08 KSI | 0.41 KSI | ||
| Fiber Content (5) Mass | mf | 63 % | 55 % | ||||
| Volume | Vf | 41 % | 33% | ||||
| Thickness | t | 0.33 in | 0.15 in | 0.17 in | |||
Discussion of Results
Tube Performance
As can be observed from table 16, there were some significant discrepancies between the experimental obtained values for the tube walls and the predicted properties. The modulus values obtained are generally higher than the predicted values, and it is not expected that the extra stiffness will cause significant problems in the final structure. The biggest concern was in regard to the strength values, where a number of the test values are only about half of the predicted capacity. It is thought that this may be due to lower overall strain capacity for the tube compared with the type of strain limits normally expected for a unidirectional test laminate. Assuming a relatively linear stress-strain relationship for the material, the predicted values indicate an assumed failure strain in the order of 2 percent. From earlier testing in this project, the failure strains for lamina test panels were in generally excess of 2 percent, so this would seem to be a reasonable assumption. However, when the tube walls were tested, the maximum strain generated was only in the 1 to 1.5 percent range. Given that the behavior of these materials was highly linear up to failure, the lower strain limits translate to a lower strength capacity. The reason for the reduced strains in the fabricated tubes is unknown, and further testing would need to be undertaken to fully understand this behavior. As such testing is beyond the scope of work for this project, it is recommended that analysis of the deck behavior be done using the actual test data.
Outer Wrap Performance
When comparing the "witness panel" for the outer wrap and the laminate sample removed from the actual deck panel, one would expect to see very similar test results. Observation of the data in table 17 shows that the data from the witness panel are consistently higher than the data for the other panel. Part of the reason for these differences is the difference in fiber volume fraction. The witness panel was prepared under idealized conditions as a small panel on a flat board. This enables the production of a better quality laminate with lower resin content. Working with the larger deck unit, where the laminate must be wrapped around the deck unit, it is harder to achieve the consolidation levels seen in the small panel. It is thought that the sample from the actual deck unit is more representative of the values which will be seen in the final deck.
Conclusion
The performance of the "as-tested" composite laminates differed from initial predictions. While preliminary design was performed using the predicted values, these actual test values were provided for final analysis computations and were shown to still provide sufficient performance. Ultimate validation of this performance was demonstrated in the testing of full-scale components.