U.S. Department of Transportation
Federal Highway Administration
1200 New Jersey Avenue, SE
Washington, DC 20590
202-366-4000
Description: Grade classification data.
Use: For investment requirements modeling to calculate vertical alignment adequacy and estimate running speed and operating costs and in the truck size and weight analysis process.
Extent: All paved interstate, other freeway and expressway, other principal arterial, and rural minor arterial Sample Panel sections; optional for all other sections beyond the limits of the Sample Panel.
Functional System |
1 |
2 |
3 |
4 |
5 |
6 |
7 |
|
|---|---|---|---|---|---|---|---|---|
NHS |
IH |
OFE |
OPA |
MiA |
MaC |
MiC |
Local |
|
Rural |
SP |
SP |
SP |
SP |
||||
Urban |
SP |
SP |
SP |
|||||
SP = Sample Panel Sections |
||||||||
Coding Requirements for Fields 8, 9, and 10:
Value_Numeric: Enter the total length of the segments that apply to each individual grade class, using the percent grade ranges listed in the table below. Each sample will need to be subdivided to report the extent of each applicable grade class.
Grade Classification |
Percent Grade |
|---|---|
A |
0.0 – 0.4 |
B |
0.5 – 2.4 |
C |
2.5 – 4.4 |
D |
4.5 – 6.4 |
E |
6.5 – 8.4 |
F |
8.5 or greater |
Value_Text: No entry required. Available for State Use.
Value_Date: No entry required. Available for State Use.
Guidance: This information may be available from construction plans, GIS databases, and contracts for other data collection activities.
Each grade and flat segment is to be coded as a separate segment; segments are typically measured between vertical points of intersection (VPI) and summed by grade class to obtain the total length in each class. The sum of all of the Grade Class lengths must equal the total length of the Sample Panel section.
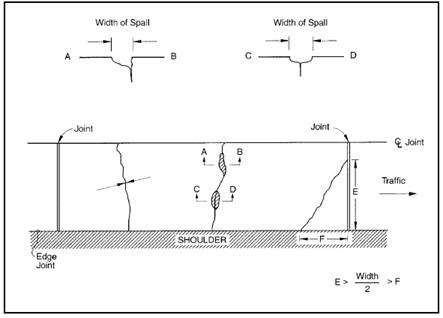
Figure 4.73 Grade Classification Example
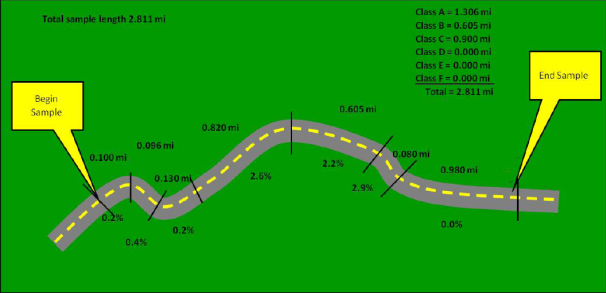
Source: TxDOT, Transportation Planning and Programming Division.
Description: The percent of a Sample Panel section meeting the sight distance requirement for passing.
Use: For investment requirements modeling to calculate capacity and estimate running speed and for truck size and weight analysis purposes.
Extent: All rural, paved two-lane Sample Panel sections; optional for all other rural sections beyond the limits of the Sample Panel.
Functional System |
1 |
2 |
3 |
4 |
5 |
6 |
7 |
|
|---|---|---|---|---|---|---|---|---|
NHS |
IH |
OFE |
OPA |
MiA |
MaC |
MiC |
Local |
|
Rural |
SP |
SP |
SP |
SP |
SP |
SP |
||
Urban |
||||||||
SP = Sample Panel Sections |
||||||||
Coding Requirements for Fields 8, 9, and 10:
Value_Numeric: Enter the percent of the section length that is striped for passing.
Value_Text: No entry required. Available for State Use.
Value_Date: No entry required. Available for State Use.
Guidance: This data item shall be reported for sample sections where passing is permitted in the inventory direction.
When there is a discernable directional difference in permitted passing per the roadway striping, code for the more restrictive direction (i.e., the direction that produces the lower value).
Description: IRI is the road roughness index most commonly used worldwide for evaluating and managing road systems. Road roughness is the primary indicator of the utility of a highway network to road users. IRI is defined as a statistic used to estimate the amount of roughness in a measured longitudinal profile.
Use: For investment requirements modeling to estimate pavement deterioration, section deficiencies, and necessary improvements, in cost allocation studies, in pavement condition trends, and for other analysis purposes including NHS performance. Also, for performance measure calculation for pavement condition on the NHS.
Extent: All NHS and principal arterial sections, and rural minor arterial Sample Panel sections; optional for urban minor arterial, major collector, and minor collector Sample Panel sections and rural major collector Sample Panel sections.
Functional System |
1 |
2 |
3 |
4 |
5 |
6 |
7 |
|
|---|---|---|---|---|---|---|---|---|
NHS |
IH |
OFE |
OPA |
MiA |
MaC |
MiC |
Local |
|
Rural |
FE |
FE |
FE |
FE |
SP |
SP* |
||
Urban |
FE |
FE |
FE |
FE |
SP* |
SP* |
SP* |
|
FE = Full Extent SP = Sample Panel Sections SP* = Sample Panel Sections (optional) |
||||||||
Coding Requirements for Fields 8, 9, and 10:
Value_Numeric: Code IRI to the nearest inch per mile.
Value_Text: No entry required if the Value_Numeric field has been populated with a newly measured value for a NHS section. If the Value_Numeric has not been populated with a newly measured value, then one of the following codes shall be provided:
Code |
Description |
|---|---|
A |
Construction – Roadway was under construction |
B |
Closure – Roadway was closed to traffic |
C |
Disaster – Roadway was located in an area declared as a disaster zone |
D |
Deterioration – Roadway is too deteriorated to measure and is already designated as “Poor” |
Value_Date: Report the month and year in MM/YYYY format, excluding leading zeroes) for when the data was collected. A default date may be used if the exact date of collection is unknown.
Guidance: The following standards shall be followed for reported IRI values:
Existing IRI values should continue to be reported until they are replaced by new measured values.
Structures and railroad grade crossings are to be included in the measurement of surface roughness.
If a measured IRI value is reported for a non-Principal Arterial System (PAS) section, a PSR value for that section is not required, as a paved Sample Panel section shall have either PSR or IRI reported.
For LRS purposes, this Data Item can be reported independently for both directions of travel associated with divided highway sections, for which dual carriageway GIS network representation is required per guidance in Chapter 3, Section 3.3 and Table 3.5. NOTE: If this data item is being reported for both the inventory and non-inventory directional approaches associated with all divided Interstate roadway sections, then the following data items shall be reported in the same manner for these roadway sections (as specified in the Metadata; see Chapter 3, Sec. 3.3, Tables 3.18 and 3.19):
Metadata: See Chapter 3 for a description of the metadata reporting requirements for this Data Item.
Description: Present Serviceability Rating (PSR) for pavement condition.
Use: For investment requirements modeling to estimate pavement deterioration, section deficiencies, and needed improvements, in cost allocation studies, in pavement condition trends, and for other analysis purposes including NHS performance. Also, for performance measure calculation for pavement condition on the NHS.
Extent: NHS, urban minor arterial, major collector, and minor collector Sample Panel sections and rural major collector Sample Panel sections where IRI is not reported.
Functional System |
1 |
2 |
3 |
4 |
5 |
6 |
7 |
|
|---|---|---|---|---|---|---|---|---|
NHS |
IH |
OFE |
OPA |
MiA |
MaC |
MiC |
Local |
|
Rural |
FE* |
FE* |
SP* |
|||||
Urban |
FE* |
FE* |
SP* |
SP* |
SP* |
|||
FE* = Full Extent (optional) SP* = Sample Panel Sections (optional) |
||||||||
Coding Requirements for Fields 8, 9, and 10:
Value_Numeric: Code a PSR or equivalent to the nearest tenth.
Value_Text: No entry required for non-NHS sections. If the Value_Numeric field has been populated for a NHS section, then this field shall be used to identify the reason as to why this data was unable to be collected on a NHS section. See the following list of eligible codes:
Code |
Description |
|---|---|
A |
Posted speed limit is less than 40 mph |
Value_Date: No entry required. Available for State Use.
Guidance: For the sections on the NHS where posted speed limit is less than 40 mph, PSR can be reported in lieu of IRI. If reported, measured PSR values shall be:
o in the rightmost through lane or one consistent lane for all data if the rightmost through lane carries traffic that is not representative of the remainder of the lanes or is not accessible due to closure, excessive congestion, or other events impacting access;
o continuously collected in a manner that will allow for reporting in nominally uniform section lengths of 0.1 mile (528 feet); shorter sections are permitted only at the beginning of a route, end of a route, at bridges, or other locations where a section length of 0.1 mile is not achievable; the maximum length of a section shall not exceed 0.11 mile in length;
For the non-NHS sections (i.e., Sample Panel sections located on non-Principal Arterial System (PAS) roadways), PSR can be reported in lieu of IRI. If reported, measured PSR values shall be:
If sufficiency ratings of pavement condition are available, they may be used after a correlation between the sufficiency rating scale and the PSR scale or other rating factors has been developed in accordance with Table 4.4 and approved by the FHWA Division Office. If there are no current PSR, PSI, or sufficiency ratings that can be adapted, the section can be rated using values in the following Table 4.4. Estimates to the nearest tenth within the applicable range shall be made (e.g., 2.3 as opposed to 2.323).
Table 4.4: Present Serviceability Rating
PSR |
Description |
|---|---|
4.0 – 5.0 |
Only new (or nearly new) superior pavements are likely to be smooth enough and distress free (sufficiently free of cracks and patches) to qualify for this category. Most pavements constructed or resurfaced during the data year would normally be rated in this category. |
3.0 – 4.0 |
Pavements in this category, although not quite as smooth as those described above, give a first class ride and exhibit few, if any, visible signs of surface deterioration. Flexible pavements may be beginning to show evidence of rutting and fine random cracks. Rigid pavements may be beginning to show evidence of slight surface deterioration, such as minor cracks and spalling. |
2.0 – 3.0 |
The riding qualities of pavements in this category are noticeably inferior to those of new pavements, and may be barely tolerable for high-speed traffic. Surface defects of flexible pavements may include rutting, map cracking, and extensive patching. Rigid pavements in this group may have a few joint failures, faulting and/or cracking, and some pumping. |
1.0 – 2.0 |
Pavements in this category have deteriorated to such an Extent that they affect the speed of free-flow traffic. Flexible pavement may have large potholes and deep cracks. Distress includes raveling, cracking, rutting and occurs over 50 percent of the surface. Rigid pavement distress includes joint spalling, patching, cracking, scaling, and may include pumping and faulting. |
0.1 – 1.0 |
Pavements in this category are in an extremely deteriorated condition. The facility is passable only at reduced speeds, and with considerable ride discomfort. Large potholes and deep cracks exist. Distress occurs over 75 percent or more of the surface. |
For LRS purposes, this Data Item can be reported independently for both directions of travel associated with divided highway sections, for which dual carriageway GIS network representation is required per guidance in Chapter 3, Section 3.3 and Table 3.5. NOTE: If this data item is being reported for both the inventory and non-inventory directional approaches associated with all divided Interstate roadway sections, then the following data items shall be reported in the same manner for these roadway sections (as specified in the Metadata; see Chapter 3, Sec. 3.3, Tables 3.18 and 3.19):
Description: Surface type on a given section.
Use: For investment requirements modeling to estimate pavement deterioration and loading history, for the cost allocation pavement model, for the national highway database, and pavement condition performance metric rating determination.
Extent: All NHS and Sample Panel sections, optional for all other sections beyond the limits of the Sample Panel.
Functional System |
1 |
2 |
3 |
4 |
5 |
6 |
7 |
|
|---|---|---|---|---|---|---|---|---|
NHS |
IH |
OFE |
OPA |
MiA |
MaC |
MiC |
Local |
|
Rural |
FE |
FE |
SP |
SP |
SP |
SP |
||
Urban |
FE |
FE |
SP |
SP |
SP |
SP |
SP |
|
FE = Full Extent SP = Sample Panel Sections |
||||||||
Coding Requirements for Fields 8, 9, and 10:
Value_Numeric: Enter the following code which best represents the type of surface:
Code |
Description |
Pavement Group |
|---|---|---|
1 |
Unpaved |
N/A |
2 |
Bituminous |
Asphalt Pavement |
3 |
JPCP – Jointed Plain Concrete Pavement (includes whitetopping) |
Jointed Concrete Pavement |
4 |
JRCP – Jointed Reinforced Concrete Pavement (includes whitetopping) |
Jointed Concrete Pavement |
5 |
CRCP – Continuously Reinforced Concrete Pavement |
CRCP |
6 |
Asphalt-Concrete (AC) Overlay over Existing AC Pavement |
Asphalt Pavement |
7 |
AC Overlay over Existing Jointed Concrete Pavement |
Asphalt Pavement |
8 |
AC (Bituminous Overlay over Existing CRCP) |
Asphalt Pavement |
9 |
Unbonded Jointed Concrete Overlay on PCC Pavement |
Jointed Concrete Pavement |
10 |
Bonded PCC Overlay on PCC Pavement |
Jointed Concrete Pavement |
11 |
Other (e.g., plank, brick, cobblestone, etc.) |
N/A |
Value_Text: No entry required. Available for State Use.
Value_Date: No entry required. Available for State Use.
Guidance: In accordance with 23 CFR 490.309(c), this data shall be collected and reported on an annual cycle for the Interstate roadways and on a 2-year maximum cycle for all other required sections.
Surface Type is a full extent item for the NHS and should be determined from visual inspection and construction records to the extent possible. Sample data needs construction record verification.
Code 1, Unpaved, on the NHS should be verified since they are very rare except in a couple of States.
Asphalt pavement is pavement constructed with asphalt materials (codes ‘2’, ‘6’, ‘7’, and ‘8’). Continuously Reinforced Concrete Pavements (CRCP) means pavements constructed of reinforced Portland cement concrete with no joints (code ‘5’). Jointed Concrete Pavements means pavements constructed of Portland cement concrete with joints. It may be constructed of either reinforced or unreinforced (plain) concrete (codes ‘3’, ‘4’, ‘9’, and ‘10’). For codes ‘7’ through ‘9’, if the existing PCC pavement is fractured (rubblized or crack-and-seated) prior to overlaying, treat the broken PCC as a base and select the surface type that best describes the new surface. For example, AC (Bituminous) surface placed over rubblized PCC is code ‘2’ with fractured PCC as the base type. For whitetopping do not treat the underlying HMA as a base type, rather follow the coding described for Item 58. Additional information can be found in Section 5.4
Whitetopping should be classified as code 3 or 4 depending on whether reinforcement is present or not. For HERS pavement modelling purposes, whitetopping will be analyzed as a PCC pavement. For whitetopping do not treat the underlying HMA as a base type, rather follow the coding described for Item 58. Modern whitetopping overlays are commonly classified by thickness and by bond with the HMA. Three distinct categories are found in the literature:
For code 6, the coding for this data item shall not be based on materials utilized for preservation treatments (e.g., thin overlays, micro-surfacing, chip seals, slurry seal, etc.) if they are less than 0.5 inch in compacted thickness. If milling/filling operations are used, revise the thickness of the layer that was milled. For example, a 7-inch bituminous pavement (code ‘2’) is milled 2 inches and a 2-inch bituminous overlay is applied. This section is then coded as a code ‘6’ with 7-inch Thickness_Flexible (Item 58) and a 2-inch Last_Overlay_Thickness (Item 56).
Code 11(Other) should be verified for the NHS since this surface type on the NHS would be extremely rare.
For LRS purposes, this Data Item can be reported independently for both directions of travel associated with divided highway sections, for which dual carriageway GIS network representation is required per guidance in Chapter 3, Section 3.3 and Table 3.5. NOTE: If this data item is being reported for both the inventory and non-inventory directional approaches associated with all divided Interstate roadway sections, then the following data items shall be reported in the same manner for these roadway sections (as specified in the Metadata; see Chapter 3, Sec. 3.3, Tables 3.18 and 3.19):
Table 4.5: Data Item Requirements by Surface Type
Code |
IRI |
PSR |
Rutting |
Faulting |
Cracking Percent |
Thickness Rigid |
Thickness Flexible |
|---|---|---|---|---|---|---|---|
1 - Unpaved |
|||||||
2 - Bituminous |
in/mi |
0.1-5.0 |
0.01” |
Fatigue % area |
0.5” |
||
3 - JPCP |
in/mi |
0.1-5.0 |
0.01” |
% cracked slabs |
0.5” |
0.5” include for white-topping only |
|
4 - JRCP |
in/mi |
0.1-5.0 |
0.01” |
% cracked slabs |
0.5” |
0.5” include for white-topping only |
|
5 - CRCP |
in/mi |
0.1-5.0 |
Punchout/long./patch % area |
0.5” |
|||
6 – Composite (AC / AC) |
in/mi |
0.1-5.0 |
0.01” |
Fatigue % area |
0.5” |
||
7 – Composite (AC / JCP) |
in/mi |
0.1-5.0 |
0.01” |
Fatigue % area |
0.5” |
0.5” |
|
8 – Composite (Bituminous / CRCP) |
in/mi |
0.1-5.0 |
0.01” |
Fatigue % area |
0.5” |
0.5” |
|
9 – Composite (Unbonded JC / PCC) |
in/mi |
0.1-5.0 |
0.01” |
% cracked slabs |
0.5” |
||
10 – Composite (Bonded JC / PCC) |
in/mi |
0.1-5.0 |
0.01” |
% cracked slabs |
0.5” |
||
11 – Other (e.g., brick) |
in/mi |
0.1-5.0 |
Item 50: Rutting (Rutting)
Description: Average depth of rutting. A rut is defined as longitudinal surface depressions in the asphalt pavement derived from measurements of a profile transverse to the path of travel on a highway lane. It may have associated transverse displacement. Asphalt pavement (Item 49 codes ‘2’, ‘6’, ‘7’, and ‘8’) is defined as pavements where the top-most surface is constructed with asphalt materials.
Use: For pavement modeling purposes and pavement condition performance metric rating.
Extent: All NHS and Sample Panel sections, optional for all other sections beyond the limits of the Sample Panel.
Functional System |
1 |
2 |
3 |
4 |
5 |
6 |
7 |
|
NHS |
IH |
OFE |
OPA |
MiA |
MaC |
MiC |
Local |
|
Rural |
FE |
FE |
SP |
SP |
SP |
SP |
||
|---|---|---|---|---|---|---|---|---|
Urban |
FE |
FE |
SP |
SP |
SP |
SP |
SP |
|
FE= Full Extent SP = Sample Panel Sections |
||||||||
Coding Requirements for Fields 8, 9, and 10:
Value_Numeric: Code the average rutting for the section to the nearest 0.01 inch. Reporting shall be consistent with IRI inventory direction lane, and section. Zero (0) values shall only be reported for roadway sections where ruts are not present.
Value_Text: No entry required if the Value_Numeric field has been populated for a NHS section. Otherwise, this field shall be used to identify the reason as to why this data was unable to be collected on a NHS section. See the following list of eligible codes:
Code |
Description |
|---|---|
A |
Construction – Roadway was under construction |
B |
Closure – Roadway was closed to traffic |
C |
Disaster – Roadway was located in an area declared as a disaster zone |
D |
Deterioration – Roadway is too deteriorated to measure and is already designated as “Poor” |
Value_Date: Report the month and year (either in MM/YYYY format, excluding leading zeroes) for when the data was collected. A default date may be used if the exact date of collection is unknown.
Guidance: The practices in the following Standard Specifications shall be followed for reporting Rutting values, as required in 23 CFR 490.309 and 490.311:
For LRS purposes, this Data Item can be reported independently for both directions of travel associated with divided highway sections, for which dual carriageway GIS network representation is required per guidance in Chapter 3, Section 3.3 and Table 3.5. NOTE: If this data item is being reported for both the inventory and non-inventory directional approaches associated with all divided Interstate roadway sections, then the following data items shall be reported in the same manner for these roadway sections (as specified in the Metadata; see Chapter 3, Sec. 3.3, Tables 3.18 and 3.19):
Default values or values obtained by other means or conversions that are not directly obtained from measured road profiles are not to be used.
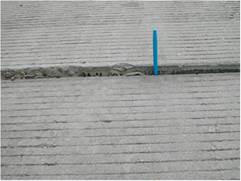
Figure 4.74 Rutting
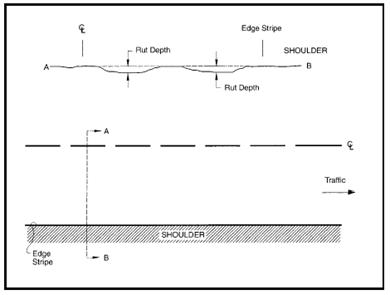
Source: LTPP Distress and Identification Manual, June 2003
Figure 4.75 Rutting Example
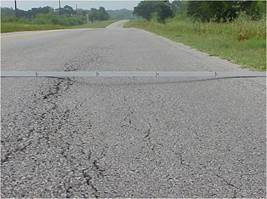
Source: TxDOT, Construction Division.
Metadata: See Chapter 3 for a description of the metadata reporting requirements for this Data Item.
Description: Faulting is defined as a vertical misalignment of pavement joints in Portland Cement Concrete Pavements (Jointed Concrete Pavement). Jointed Concrete Pavements is defined as pavements where the top-most surface is constructed of Portland cement concrete with joints (Item 49 codes ‘3’, ‘4’, ‘9’, ‘10’, and ‘11’). It may be constructed of either reinforced or unreinforced (plain) concrete.
Use: For pavement modeling purposes and pavement condition performance metric rating.
Extent: All NHS and Sample Panel sections, optional for all other sections beyond the limits of the Sample Panel.
Functional System |
1 |
2 |
3 |
4 |
5 |
6 |
7 |
|
|---|---|---|---|---|---|---|---|---|
NHS |
IH |
OFE |
OPA |
MiA |
MaC |
MiC |
Local |
|
Rural |
FE |
FE |
SP |
SP |
SP |
SP |
||
Urban |
FE |
FE |
SP |
SP |
SP |
SP |
SP |
|
FE = Full Extent SP = Sample Panel Sections |
||||||||
Coding Requirements for Fields 8, 9, and 10:
Value_Numeric: Report the average/mean absolute faulting of all joints in a section to the nearest 0.01 inch. Reporting shall be consistent with IRI inventory direction lane, and section. Zero (0) values shall only be reported for roadway sections where faults are not present.
Value_Text: No entry required if the Value_Numeric field has been populated for a NHS section. Otherwise, this field shall be used to identify the reason as to why this data was unable to be collected on a NHS section. See the following list of eligible codes:
Code |
Description |
|---|---|
A |
Construction – Roadway was under construction |
B |
Closure – Roadway was closed to traffic |
C |
Disaster – Roadway was located in an area declared as a disaster zone |
D |
Deterioration – Roadway is too deteriorated to measure and is already designated as “Poor” |
Value_Date: Report the month and year (either in MM/YYYY format, excluding leading zeroes) for when the data was collected. A default date may be used if the exact date of collection is unknown.
Guidance: The practices in the following Standard Specifications shall be followed for reporting Faulting values, as required in 23 CFR 490.309 and 490.311:
Faulting at cracks shall not be included in this measure, only at joints.
Every joint shall be measured in the right wheel-path over a section and the average absolute faulting reported.
For LRS purposes, this Data Item can be reported independently for both directions of travel associated with divided highway sections, for which dual carriageway GIS network representation is required per guidance in Chapter 3, Section 3.3 and Table 3.5. NOTE: If this data item is being reported for both the inventory and non-inventory directional approaches associated with all divided Interstate roadway sections, then the following data items shall be reported in the same manner for these roadway sections (as specified in the Metadata; see Chapter 3, Sec. 3.3, Tables 3.18 and 3.19):
Default values or values obtained by other means or conversions that are not directly obtained from measured road profiles shall not to be used.
Figure 4.76: Faulting
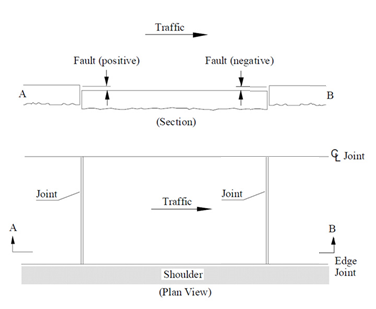
Source: LTPP Distress and Identification Manual, June 2003
Figure 4.77: Faulting Example
Source: TxDOT, Construction Division.
Metadata: See Chapter 3 for a description of the metadata reporting requirements for this Data Item.
Description: Cracking is defined as a fissure or discontinuity of the pavement surface not necessarily extending through the entire thickness of the pavement . Cracking Percent is defined as the percentage of pavement surface exhibiting cracking as follows:
Use: For pavement modeling purposes and pavement condition performance metric rating.
Extent: All NHS and Sample Panel sections; optional for all other sections beyond the limits of the Sample Panel.
Functional System |
1 |
2 |
3 |
4 |
5 |
6 |
7 |
|
|---|---|---|---|---|---|---|---|---|
NHS |
IH |
OFE |
OPA |
MiA |
MaC |
MiC |
Local |
|
Rural |
FE |
FE |
SP |
SP |
SP |
SP |
||
Urban |
FE |
FE |
SP |
SP |
SP |
SP |
SP |
|
FE = Full Extent SP = Sample Panel Sections |
||||||||
Coding Requirements for Fields 8, 9, and 10:
Value_Numeric: Report the percent of total section area for asphalt pavement and CRCP and percent of slabs for Jointed Concrete Pavements to the nearest 1%. Zero (0) values shall only be reported for roadway sections where cracks are not present.
Value_Text: No entry required if the Value_Numeric field has been populated for a NHS section. Otherwise, this field shall be used to identify the reason as to why this data was unable to be collected on a NHS section. See the following list of eligible codes:
Code |
Description |
|---|---|
A |
Construction – Roadway was under construction |
B |
Closure – Roadway was closed to traffic |
C |
Disaster – Roadway was located in an area declared as a disaster zone |
D |
Deterioration – Roadway is too deteriorated to measure and is already designated as “Poor” |
Value_Date: Report the month and year (either in MM/YYYY format, excluding leading zeroes) for when the data was collected. A default date may be used if the exact date of collection is unknown.
Guidance: For Asphalt pavements (Item 49 codes ‘2’, ‘6’, ‘7’, and ‘8’):
The practices in one of the following Standard Specifications shall be followed for reporting Cracking values, as required in 23 CFR 490.309 and 490.311:
For Jointed Concrete Pavements (Item 49 codes ‘3’, ‘4’, ‘9’, ‘10’, and ‘11’):
The following practices shall be followed for reporting Cracking values for jointed Concrete Pavements, as required in 23 CFR 490.309 and 490.311:
For Continuously Reinforced Concrete Pavements (Item 49 code ‘5’):
The following practices shall be followed for reporting Cracking values for CRCP, as required in 23 CFR 490.309 and 490.311:
For all pavement sections:
Reporting shall be consistent with IRI inventory direction, lane and section.
For LRS purposes, this Data Item can be reported independently for both directions of travel associated with divided highway sections, for which dual carriageway GIS network representation is required per guidance in Chapter 3, Section 3.3 and Table 3.5. NOTE: If this data item is being reported for both the inventory and non-inventory directional approaches associated with all divided Interstate roadway sections, then the following data items shall be reported in the same manner for these roadway sections (as specified in the Metadata; see Chapter 3, Sec. 3.3, Tables 3.18 and 3.19):
Default values or values obtained by other means or conversions that are not directly obtained from measured road profiles are not to be used.
All severity levels of associated cracking should be considered and reported, both sealed and unsealed.
Examples of Procedures to Estimate Cracking Percent
For AC pavements, an estimate of the total area of fatigue cracking for the section shall be reported. As an example, if the section is a single lane, 12 foot in width, 0.1 mile in length; total area = 6336 sq. ft.
The fatigue cracking occupies 200 feet in length in the outside wheelpath and 125 feet in length in the inside wheelpath. The wheelpath width is defined as a 39 inches width in each wheel path:
200 ft. + 125 ft. = 325 ft. total length of wheelpath with fatigue cracking
325 ft. * 39 inches / 12 inches per ft. = 1056.25 sq. ft.
1056.25 sq. ft. / 6336 sq. ft. = 16.67 percent area of fatigue cracking which can be reported as 17 percent
For Asphalt pavements, Cracking Percent should not generally exceed 54 percent for 12 foot lane width, 59 percent for 11 foot lanes, or 65 percent for 10 foot lanes.
For jointed PCC pavements as an example, if a 0.1 mile section has 4 slabs of 33 having some transverse cracking, you would report 12% slab cracking.
For a CRCP example, if a 0.1 mile section, 12 foot lane; has a punchout that occupies 20 square feet, 10 lineal feet of longitudinal cracking, and three 6 square foot patch.
Distress = 20 sf + (10 ft. *1 ft.) + (3*6 sf) = 48 sf
48 sf / 6336 sf = 0.8 percent cracking, may be reported as 1 percent.
Figure 4.78: AC Fatigue Type Cracking
Source: LTPP Distress and Identification Manual, May 2014
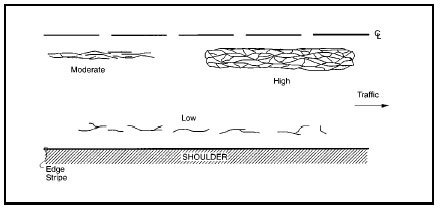
Figure 4.79: AC Longitudinal Cracking (Inside and Outside of Wheel path)
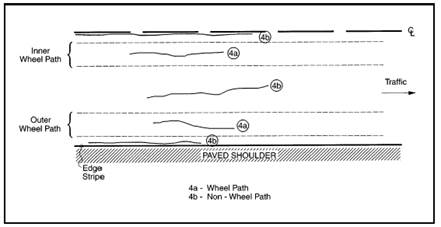
Source: LTPP Distress and Identification Manual, May 2014
Figure 4.80: AC Moderate Severity Longitudinal Cracking (Wheel path)

Source: LTPP Distress and Identification Manual, May 2014
Figure 4.81: AC Chicken Wire/Alligator Fatigue Type Cracking in Wheel path  Source: LTPP Distress and Identification Manual, May 2014 |
Figure 4.82: AC Low Severity Fatigue Type Cracking 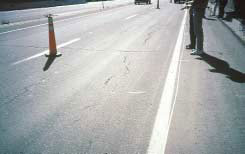 Source: LTPP Distress and Identification Manual, May 2014 |
Figure 4.83: AC Moderate Severity Fatigue Type Cracking  Source: LTPP Distress and Identification Manual, May 2014 |
Figure 4.84: AC High Severity Fatigue Type Cracking 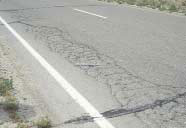 Source: LTPP Distress and Identification Manual, May 2014 |
Figure 4.85: CRCP Fatigue Type Cracking (Punchouts)
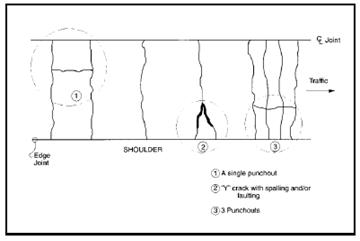
Source: LTPP Distress and Identification Manual, May 2014
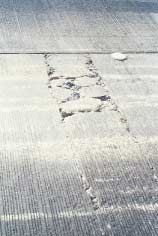
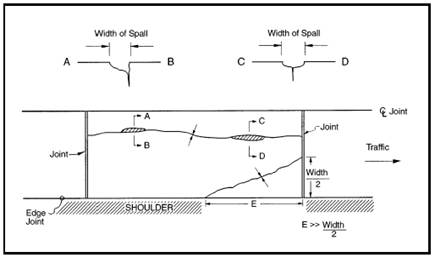
Figure 4.86: Low Severity CRCP Punchout Cracking

Source: LTPP Distress and Identification Manual, May 2014
Figure 4.87: Moderate Severity CRCP Punchout Cracking

Source: LTPP Distress and Identification Manual, May 2014
Figure 4.88: High Severity CRCP Punchout Cracking
Source: LTPP Distress and Identification Manual, May 2014
Figure 4.89: JCP Longitudinal Cracking
Source: LTPP Distress and Identification Manual, May 2014
Figure 4.90: JCP Low Severity Longitudinal Cracking

Source: LTPP Distress and Identification Manual, May 2014
Figure 4.91: JCP Moderate Severity Longitudinal Cracking

Source: LTPP Distress and Identification Manual, May 2014
Figure 4.92: JCP High Severity Longitudinal Cracking

Source: LTPP Distress and Identification Manual, May 2014
Figure 4.93: JCP Transverse Cracking
Source: LTPP Distress and Identification Manual, May 2014
Figure 4.94: JCP Moderate Severity Transverse Cracking

Source: LTPP Distress and Identification Manual, May 2014
Figure 4.95: JCP High Severity Transverse Cracking

Source: LTPP Distress and Identification Manual, May 2014
Metadata: See Chapter 3 for a description of the metadata reporting requirements for this Data Item.
Description: The year in which the roadway surface was last improved.
Use: For the cost allocation pavement model.
Extent: All paved Sample Panel sections; optional for all other sections beyond the limits of the Sample Panel.
Functional System |
1 |
2 |
3 |
4 |
5 |
6 |
7 |
|
|---|---|---|---|---|---|---|---|---|
NHS |
IH |
OFE |
OPA |
MiA |
MaC |
MiC |
Local |
|
Rural |
SP |
SP |
SP |
SP |
SP |
SP |
||
Urban |
SP |
SP |
SP |
SP |
SP |
SP |
SP |
|
SP = Sample Panel Sections |
||||||||
Coding Requirements for Fields 8, 9, and 10:
Value_Numeric: No entry required. Available for State Use.
Value_Text: No entry required. Available for State Use.
Value_Date: Enter the year (in YYYY format) for when the last surface improvement was completed.
Guidance: Reporting shall be consistent with IRI inventory direction and lane.
0.5 inch or more of compacted pavement material must be put in place for it to be considered a surface improvement.
Completion date is the actual date the construction ended or the date when the project was opened to traffic.
Retain the coded improvement year until another improvement affecting the surface is completed.
Figure 4.96: Resurfaced Roadway
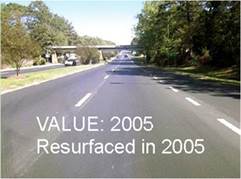
Source: FDOT RCI Field Handbook, Nov. 2008.
Description: The year in which the roadway was constructed or reconstructed.
Use: For pavement modeling purposes.
Extent: All paved Sample Panel sections; optional for all other sections beyond the limits of the Sample Panel.
Functional System |
1 |
2 |
3 |
4 |
5 |
6 |
7 |
|
NHS |
IH |
OFE |
OPA |
MiA |
MaC |
MiC |
Local |
|
Rural |
SP |
SP |
SP |
SP |
SP |
SP |
||
|---|---|---|---|---|---|---|---|---|
Urban |
SP |
SP |
SP |
SP |
SP |
SP |
SP |
|
SP = Sample Panel Sections |
||||||||
Coding Requirements for Fields 8, 9, and 10:
Value_Numeric: No entry required. Available for State Use.
Value_Text: No entry required. Available for State Use.
Value_Date: Enter the year (in YYYY format) for when the roadway was last constructed or reconstructed.
Guidance: Reporting shall be consistent with IRI inventory direction and lane.
Reconstruction is the replacement of the existing pavement structure with an equivalent or increased structure. Although recycled materials may be used in the new pavement structure, reconstruction usually requires the complete removal and replacement of at least the old pavement surface, and often also the base.
If a new pavement surface were placed without first removing the old pavement surface, the resulting pavement should be considered an overlay (surface improvement, not construction), even if the existing pavement was rubblized prior to placing the new pavement surface.
Description: Thickness of the most recent pavement overlay.
Use: For pavement modeling purposes.
Extent: All paved Sample Panel sections; optional for all other sections beyond the limits of the Sample Panel.
Functional System |
1 |
2 |
3 |
4 |
5 |
6 |
7 |
|
|---|---|---|---|---|---|---|---|---|
NHS |
IH |
OFE |
OPA |
MiA |
MaC |
MiC |
Local |
|
Rural |
SP |
SP |
SP |
SP |
SP |
SP |
||
Urban |
SP |
SP |
SP |
SP |
SP |
SP |
SP |
|
SP = Sample Panel Sections |
||||||||
Coding Requirements for Fields 8, 9, and 10:
Value_Numeric: Code the actual measured value to the nearest 0.5 inch.
Value_Text: No entry required. Available for State Use.
Value_Date: No entry required. Available for State Use.
Guidance: Reporting shall be consistent with IRI inventory direction and lane.
Values can also be obtained from construction plans for use in the Table.
An overlay is more than 0.5 inch.
In cases in which the surface has been milled off an AC surface type and overlaid, the newly overlaid thickness is to be coded for this data item. Note that if the overlaid layer is the same thickness that was milled, there will be no change to the value coded for Data Item 58 (Thickness_Flexible) and; if more/less material was overlaid than was milled, the Data Item 58 (Thickness_Flexible) should reflect the resulting total overall thickness.
Description: Thickness of rigid pavement.
Use: For investment requirements modeling to estimate pavement deterioration and loading history and in the cost allocation pavement model.
Extent: All paved Sample Panel sections; optional for all other sections beyond the limits of the Sample Panel.
Functional System |
1 |
2 |
3 |
4 |
5 |
6 |
7 |
|
|---|---|---|---|---|---|---|---|---|
NHS |
IH |
OFE |
OPA |
MiA |
MaC |
MiC |
Local |
|
Rural |
SP |
SP |
SP |
SP |
SP |
SP |
||
Urban |
SP |
SP |
SP |
SP |
SP |
SP |
SP |
|
SP = Sample Panel Sections |
||||||||
Coding Requirements for Fields 8, 9, and 10:
Value_Numeric: Code the actual measured value to the nearest 0.5 inch.
Value_Text: No entry required. Available for State Use.
Value_Date: No entry required. Available for State Use.
Guidance: The thickness shall reflect the last improvement on the section. When an improvement is made, consider all new or redesigned base and pavement materials when determining the appropriate value.
Reporting shall be consistent with IRI inventory direction and lane.
Values can also be obtained from construction plans for use in the Table.
Definitions: Refer to the table of codes in Data Item 49 (Surface Type)
Report total thickness of all PCC pavement layer(s); if PCC has been overlaid on AC (“white topped”) (i.e., composite), report the PCC layer thickness on top; if AC has been overlaid on PCC (i.e., composite), report the PCC layer thickness under the AC on top.
For code ‘9’ (Unbonded Jointed Concrete Overlay on PCC Pavement), only the unbounded overlay should be considered and reported for this data item. For code ‘10’ (Bonded PCC Overlay on PCC Pavement), both bonded overlay and underlying rigid pavement surface layer should be considered and reported for this data item.
Description: Thickness of the flexible pavement.
Use: For investment requirements modeling to estimate pavement deterioration and loading history and in the cost allocation pavement model.
Extent: All paved Sample Panel sections; optional for all other sections beyond the limits of the Sample Panel.
Functional System |
1 |
2 |
3 |
4 |
5 |
6 |
7 |
|
NHS |
IH |
OFE |
OPA |
MiA |
MaC |
MiC |
Local |
|
Rural |
SP |
SP |
SP |
SP |
SP |
SP |
||
|---|---|---|---|---|---|---|---|---|
Urban |
SP |
SP |
SP |
SP |
SP |
SP |
SP |
|
SP = Sample Panel Sections |
||||||||
Coding Requirements for Fields 8, 9, and 10:
Value_Numeric: Code the actual measured value to the nearest 0.5 inch.
Value_Text: No entry required. Available for State Use.
Value_Date: No entry required. Available for State Use.
Guidance: Reporting shall be consistent with IRI inventory direction and lane.
Values can also be obtained from construction plans for use in the Table.
Definitions: Refer to the table of codes in Data Item 49 (Surface Type).
Report total thickness of all AC (asphalt) pavement layer(s); if PCC has been overlaid on AC (“white topped”) (i.e., composite), report the AC layer thickness under it; if AC has been overlaid on PCC (i.e., composite), report the AC layer thickness on top.
Description: The base pavement type.
Use: For pavement modeling purposes.
Extent: All paved Sample Panel sections; optional for all other sections beyond the limits of the Sample Panel.
Functional System |
1 |
2 |
3 |
4 |
5 |
6 |
7 |
|
|---|---|---|---|---|---|---|---|---|
NHS |
IH |
OFE |
OPA |
MiA |
MaC |
MiC |
Local |
|
Rural |
SP |
SP |
SP |
SP |
SP |
SP |
||
Urban |
SP |
SP |
SP |
SP |
SP |
SP |
SP |
|
SP = Sample Panel Sections |
||||||||
Coding Requirements for Fields 8, 9, and 10:
Value_Numeric: Supply the appropriate code using the following codes:
Code |
Description |
Definitions |
|---|---|---|
1 |
No Base |
Surface layer is placed directly on subgrade without a base |
2 |
Aggregate |
Non-stabilized granular, consisting of either crushed stone, gravel, recycled asphalt or concrete |
3 |
Asphalt or Cement Stabilized |
Aggregate base treated with either asphalt or Portland cement |
5 |
Hot Mix AC (Bituminous) |
Either a new hot-mix asphalt (HMA) layer placed as the base layer or the HMA surface of an old flexible pavement |
6 |
Lean Concrete |
A Portland cement concrete mixture made with relatively low cement content (typically about 3 sacks/yd.) |
7 |
Stabilized Open-graded Permeable |
Open-graded aggregate treated with either asphalt or Portland cement for stability |
8 |
Fractured PCC |
Rubblized or crack-and-seated PCC pavement |
Value_Text: No entry required. Available for State Use.
Value_Date: No entry required. Available for State Use.
Guidance: For rigid pavements the base is all layers between subgrade and bottom of concrete surface. For flexible pavements the base is all layers between subgrade and bottom of asphalt concrete layer. If you have several types of base, use the code that best describes the layer immediately below the surface layer.
Reporting shall be consistent with IRI inventory direction and lane.
Description: The thickness of the base pavement.
Use: For pavement modeling purposes.
Extent: All paved Sample Panel sections; optional for all other sections beyond limits of the Sample Panel.
Functional System |
1 |
2 |
3 |
4 |
5 |
6 |
7 |
|
|---|---|---|---|---|---|---|---|---|
NHS |
IH |
OFE |
OPA |
MiA |
MaC |
MiC |
Local |
|
Rural |
SP |
SP |
SP |
SP |
SP |
SP |
||
Urban |
SP |
SP |
SP |
SP |
SP |
SP |
SP |
|
SP = Sample Panel Sections |
||||||||
Coding Requirements for Fields 8, 9, and 10:
Value_Numeric: Code the actual measured value to the nearest inch.
Value_Text: No entry required. Available for State Use.
Value_Date: No entry required. Available for State Use.
Guidance: For rigid pavements the base is all layers between subgrade and bottom of concrete surface. For flexible pavements the base is all layers between subgrade and bottom of asphalt concrete layer. If there are several types of base, report the total thickness of all base layers
Reporting shall be consistent with IRI inventory direction and lane.
Values can also be obtained from construction plans for use in the Table.
Description: Climate zone as defined by the 4 LTPP climate zone descriptions.
Use: For cost allocation pavement model purposes.
Extent: All paved Sample Panel sections; optional for all other sections beyond the limits of the Sample Panel.
Functional System |
1 |
2 |
3 |
4 |
5 |
6 |
7 |
|
|---|---|---|---|---|---|---|---|---|
NHS |
IH |
OFE |
OPA |
MiA |
MaC |
MiC |
Local |
|
Rural |
SP |
SP |
SP |
SP |
SP |
SP |
||
Urban |
SP |
SP |
SP |
SP |
SP |
SP |
SP |
|
SP = Sample Panel Sections |
||||||||
Coding Requirements for Fields 8, 9, and 10:
Value_Numeric: Enter the applicable Long Term Pavement Performance (LTPP) climate zone code:
Code |
Description |
|---|---|
1 |
Wet-Freeze |
2 |
Wet-Non-freeze |
3 |
Dry-Freeze |
4 |
Dry-Non-freeze |
Value_Text: No entry required. Available for State Use.
Value_Date: No entry required. Available for State Use.
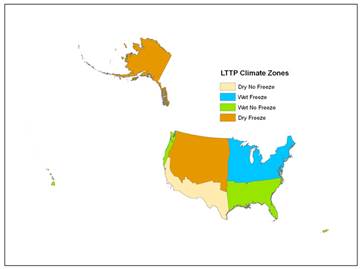
Guidance: This data item will be populated by FHWA using the map shown in Figure 4.97, if the States do not provide this information.
Figure 4.97: LTPP Climate Zone Map
Description: Soil type as defined by AASHTO soil classes.
Use: For pavement modeling purposes.
Extent: All paved Sample Panel sections; optional for all other sections beyond the limits of the Sample Panel.
Functional System |
1 |
2 |
3 |
4 |
5 |
6 |
7 |
|
|---|---|---|---|---|---|---|---|---|
NHS |
IH |
OFE |
OPA |
MiA |
MaC |
MiC |
Local |
|
Rural |
SP |
SP |
SP |
SP |
SP |
SP |
||
Urban |
SP |
SP |
SP |
SP |
SP |
SP |
SP |
|
SP = Sample Panel Sections |
||||||||
Coding Requirements for Fields 8, 9, and 10:
Value_Numeric: *Enter the applicable AASHTO soil class code:
Code |
Description |
|---|---|
1 |
Granular (35% or less passing the 0.075 mm sieve) (AASHTO Soil Class A0 through A-3) |
2 |
Fine (Silt-Clay) Materials (>35% passing the 0.075 mm sieve) (AASHTO Soil Class A-4 through A-7) |
Value_Text: No entry required. Available for State Use.
Value_Date: No entry required. Available for State Use.
Guidance: This data item will be populated by FHWA if the States do not provide this information.
Description: The County Federal Information Processing Standard (FIPS) code.
Use: For identifying the County for which the data is being reported.
Extent: All Public highways as Identified in 23 U.S.C 101.a(27).
Functional System |
1 |
2 |
3 |
4 |
5 |
6 |
7 |
|
|---|---|---|---|---|---|---|---|---|
NHS |
IH |
OFE |
OPA |
MiA |
MaC |
MiC |
Local |
|
Rural |
FE |
FE |
FE |
FE |
FE |
FE |
FE |
FE |
Urban |
FE |
FE |
FE |
FE |
FE |
FE |
FE |
FE |
FE = Full Extent |
||||||||
Coding Requirements for Fields 8, 9, and 10:
Value_Numeric: Enter the three-digit County FIPS code.
Value_Text: No entry required. Available for State Use.
Value_Date: No entry required. Available for State Use.
Guidance: The official (three-digit) codes are defined in the National Institute of Standards and Technology (NIST) FIPS Publication 6-4.
See Appendix J for codes to be used for Alaska, District of Columbia (DC), and Puerto Rico.
Description: A Roadway that is a component of the National Highway System (NHS).
Use: For analysis and mapping of NHS information and for defining extent for performance metric rating determination.
Extent: All roadways that are designated NHS routes (as of December 31st of the applicable data year), excluding ramps.
Functional System |
1 |
2 |
3 |
4 |
5 |
6 |
7 |
|---|---|---|---|---|---|---|---|
IH |
OFE |
OPA |
MiA |
MaC |
MiC |
Local |
|
Rural |
FE** |
FE** |
FE** |
FE** |
FE** |
FE** |
FE** |
Urban |
FE** |
FE** |
FE** |
FE** |
FE** |
FE** |
FE** |
FE** = Full Extent wherever data item is applicable SP = Sample Panel Sections |
|||||||
Coding Requirements for Fields 8, 9, and 10:
Value Numeric: Code the value that represents the type of NHS facility as follows:
Code |
Description |
|---|---|
1 |
Non Connector NHS |
2 |
Major Airport |
3 |
Major Port Facility |
4 |
Major Amtrak Station |
5 |
Major Rail/Truck Terminal |
6 |
Major Inter City Bus Terminal |
7 |
Major Public Transportation or Multi-Modal Passenger Terminal |
8 |
Major Pipeline Terminal |
9 |
Major Ferry Terminal |
Value_Text: No entry required. Available for State Use.
Value_Date: Required. The Month and Year that the NHS section was officially approved.
Guidance: Code this data item for roadway segments that reside on an official NHS route.
Use Code ‘1’ (Non-connector NHS) to identify STRAHNET connectors.
For LRS purposes, this Data Item shall be reported independently for both directions of travel associated with divided highway sections, for which dual carriageway GIS network representation is required per guidance in Chapter 3, Section 3.3 and Table 3.5.
The States shall provide their NHS data to FHWA as part of their annual submittal until directed otherwise by the FHWA Office of Highway Policy Information.
Provided that FHWA assumes the role of maintaining these datasets in the future, the States will be responsible for submitting additions, deletions, and changes to these networks to FHWA for approval, as directed by the procedures outlined in the appropriate sections of Title 23 CFR, U.S.C., and FHWA regulations.
Description: Roadway section that is a component of the Strategic Highway Network (STRAHNET).
Use: For analysis and mapping of STRAHNET information.
Extent: All roadways that are designated STRAHNET routes.
Functional System |
1 |
2 |
3 |
4 |
5 |
6 |
7 |
|---|---|---|---|---|---|---|---|
IH |
OFE |
OPA |
MiA |
MaC |
MiC |
Local |
|
Rural |
FE** |
FE** |
FE** |
FE** |
FE** |
FE** |
FE** |
Urban |
FE** |
FE** |
FE** |
FE** |
FE** |
FE** |
FE** |
FE** = Full Extent wherever data item is applicable |
|||||||
Coding Requirements for Fields 8, 9, and 10:
Value_Numeric: Code the value that represents the type of STRAHNET facility as follows:
Code |
Description |
|---|---|
1 |
Regular STRAHNET |
2 |
Connector |
Value_Text: Military Base Name (if one exists).
Value_Date: Optional. The Month and Year that the STRAHNET section was officially approved.
Guidance: Code this data item for roadway segments that reside on an official STRAHNET route.
The States shall provide their STRAHNET data to FHWA as part of their annual submittal until directed otherwise by the FHWA Office of Highway Policy Information.
Provided that FHWA assumes the role of maintaining these datasets in the future, the States will be responsible for submitting additions, deletions, and changes to these networks to FHWA for approval, as directed by the procedures outlined in the appropriate sections of Title 23 CFR, U.S.C., and FHWA regulations.
Description: Roadway section that is a component of the National Truck Network (NN) as defined by 23 CFR 658.
Use: For analysis and mapping of NN information.
Extent: All roadways that are designated NN routes.
Functional System |
1 |
2 |
3 |
4 |
5 |
6 |
7 |
|---|---|---|---|---|---|---|---|
IH |
OFE |
OPA |
MiA |
MaC |
MiC |
Local |
|
Rural |
FE** |
FE** |
FE** |
FE** |
FE** |
FE** |
FE** |
Urban |
FE** |
FE** |
FE** |
FE** |
FE** |
FE** |
FE** |
FE** = Full Extent wherever data item is applicable |
|||||||
Coding Requirements for Fields 8, 9, and 10:
Value_Numeric: Code the value that represents the type of truck facility as follows:
Code |
Description |
|---|---|
1 |
Section is on the National Network (NN) |
2 |
Other State-designated truck route (optional) |
Value_Text: No entry required. Available for State Use.
Value_Date: Optional. The Month and Year that the National Truck Network section was officially approved.
Guidance: Code this data item for roadway segments that reside on an official National Network route.
The States shall provide their NN data to FHWA as part of their annual submittal until directed otherwise by the FHWA Office of Highway Policy Information.
Provided that FHWA assumes the role of maintaining these datasets in the future, the States will be responsible for submitting additions, deletions, and changes to these networks to FHWA for approval, as directed by the procedures outlined in the appropriate sections of Title 23 CFR, U.S.C., and FHWA regulations.
Description: An unbuilt roadway (or section) of the National Highway System (NHS), including intermodal connectors.
Use: For analysis and mapping of future NHS information.
Extent: All roadways that are designated future NHS routes.
Functional System |
1 |
2 |
3 |
4 |
5 |
6 |
7 |
|---|---|---|---|---|---|---|---|
IH |
OFE |
OPA |
MiA |
MaC |
MiC |
Local |
|
Rural |
FE** |
FE** |
FE** |
FE** |
FE** |
FE** |
FE** |
Urban |
FE** |
FE** |
FE** |
FE** |
FE** |
FE** |
FE** |
FE** = Full Extent wherever data item is applicable |
|||||||
Coding Requirements for Fields 8, 9, and 10:
Value_Numeric: Code as follows future NHS facilities as follows:
Code |
Description |
|---|---|
1 |
Un-built NHS section |
Value_Text: No entry required. Available for State Use.
Value_Date: Optional. The Month and Year that the Future NHS section was officially approved.
Guidance: Code this data item for roadway segments that may ultimately reside (i.e. awaiting FHWA approval) on an official NHS route.
The States shall provide their future NHS data to FHWA as part of their annual submittal until directed otherwise by the FHWA Office of Highway Policy Information.
Provided that FHWA assumes the role of maintaining these datasets in the future, the States will be responsible for submitting additions, deletions, and changes to these networks to FHWA for approval, as directed by the procedures outlined in the appropriate sections of Title 23 CFR, U.S.C., and FHWA regulations.
Description: The legal entity that maintains and operates a roadway.
Use: For administrative, legislative, analytical, and national highway database purposes.
Extent: All roadways that are toll facilities, whether public or privately-owned / operated; optional for all other sections.
Functional System |
1 |
2 |
3 |
4 |
5 |
6 |
7 |
|
|---|---|---|---|---|---|---|---|---|
NHS |
IH |
OFE |
OPA |
MiA |
MaC |
MiC |
Local |
|
Rural |
FE** |
FE** |
FE** |
FE** |
FE** |
FE** |
FE** |
FE** |
Urban |
FE** |
FE** |
FE** |
FE** |
FE** |
FE** |
FE** |
FE** |
FE** = Full Extent wherever data item is applicable |
||||||||
Coding Requirements for Fields 8, 9, and 10:
Value_Numeric: Code the level of government that best represents who maintains and operates the highway irrespective of ownership or agreements for other purposes. If more than one code applies, use the lowest numerical value from the following:
Code |
Description |
Code |
Description |
|---|---|---|---|
1 |
State Highway Agency |
60 |
Other Federal Agency |
2 |
County Highway Agency |
62 |
Bureau of Indian Affairs |
3 |
Town or Township Highway Agency |
63 |
Bureau of Fish and Wildlife |
4 |
City or Municipal Highway Agency |
64 |
U.S. Forest Service |
11 |
State Park, Forest, or Reservation Agency |
66 |
National Park Service |
12 |
Local Park, Forest or Reservation Agency |
67 |
Tennessee Valley Authority |
21 |
Other State Agency |
68 |
Bureau of Land Management |
25 |
Other Local Agency |
69 |
Bureau of Reclamation |
26 |
Private (other than Railroad) |
70 |
Corps of Engineers |
27 |
Railroad |
72 |
Air Force |
31 |
State Toll Authority |
73 |
Navy/Marines |
32 |
Local Toll Authority |
74 |
Army |
40 |
Other Public Instrumentality (i.e., Airport) |
80 |
Other |
50 |
Indian Tribe Nation |
Value_Text: Optional. Enter secondary operator information, if applicable.
Value_Date: No entry required. Available for State Use.
Guidance: The term "maintenance and operations" covers the preservation and performance of the highway, including surface, shoulders, roadsides, structures, and such traffic-control devices as are necessary for safe and efficient utilization of the highway.
“State” maintained means one of the 50 States, the District of Columbia, or the Commonwealth of Puerto Rico including quasi-official State commissions or organizations;
“County, local, municipal, town, or township” means maintained by one of the officially recognized governments established under State authority;
“Federal” means maintained by one of the branches of the U.S. Government or independent establishments, government corporations, quasi-official agencies, organizations, or instrumentalities;
“Other” means any other group not already described above or nongovernmental organization that maintains the highway.
In cases where maintenance and operations responsibilities are shared between multiple entities, this item shall be coded based on the entity that has the larger degree of responsibility for maintenance and operations. Information on additional entities shall be entered in Data Field 9 (Value_Text) for this item.
Description: The capacity of the roadway as estimated by the State DOT or local agency.
Use: For investment requirements modeling to calculate capacity, the cost allocation pavement model, and congestion, delay and other analyses.
Extent: All Sample Panel sections.
Functional System |
1 |
2 |
3 |
4 |
5 |
6 |
7 |
|
|---|---|---|---|---|---|---|---|---|
NHS |
IH |
OFE |
OPA |
MiA |
MaC |
MiC |
Local |
|
Rural |
SP |
SP |
SP |
SP |
SP |
SP |
||
Urban |
SP |
SP |
SP |
SP |
SP |
SP |
SP |
|
SP = Sample Panel Sections |
||||||||
Coding Requirements for Fields 8, 9, and 10:
Data Item Value: Enter the estimated capacity for a given roadway
Value_Text: No entry required. Available for State Use.
Value_Date: No entry required. Available for State Use.
Guidance: This item should be estimated based on procedures consistent with the Highway Capacity Manual (HCM). If this data item is not coded (i.e., not provided by the State DOT), FHWA will calculate this information per HCM-based procedures. For reference purposes, FHWA will provide capacity calculation documentation and HPMS software-based procedures upon request.
The capacity of a roadway facility is the maximum reasonable hourly rate at which vehicles can be expected to transverse a point or a uniform section of lane or roadway during a given time period under prevailing roadway, traffic, and control conditions. Reasonable expectancy is that the stated capacity can be achieved repeatedly. The (HCM) provides procedures, formulas, graphics, and tables in assessing roadway capacity.
All urban and rural capacity for freeways and other multilane facilities is for the peak direction. If a rural facility has 2 or 3 lanes with one-way operation, it is considered to be a multilane facility for determining capacity. The capacity for rural facilities with 2 or 3 lanes and two-way operation is for both directions.
Description: The number of lanes designated for through-traffic, for a given direction of travel on a divided highway section.
Use: For querying and analysis of pavement performance metrics for Transportation Performance Management (TPM) purposes.
Extent: All divided Interstate highway sections, where pavement distresses have been reported independently for the inventory and non-inventory directions of travel.
Functional System |
1 |
2 |
3 |
4 |
5 |
6 |
7 |
|
|---|---|---|---|---|---|---|---|---|
NHS |
IH |
OFE |
OPA |
MiA |
MaC |
MiC |
Local |
|
Rural |
FE* |
|||||||
Urban |
FE* |
|||||||
FE* = Full Extent (*See ‘NOTE’ below) |
||||||||
*NOTE: This data item is only required to be reported when pavement distresses and other related data items (e.g., IRI, Surface Type, Rutting, etc.) have been reported independently for the inventory and non-inventory directions of travel associated with divided highway sections (see Chapter 2 - Sec. 2.7, Chapter. 3 - Sec. 3.3 (“Metadata” discussion), and Sec. 4.3 discussion for additional information). |
||||||||
Coding Requirements for Fields 8, 9, and 10:
Value_Numeric: Enter the number of through lanes designated for through-traffic in a given direction of travel (e.g.., westbound only) associated with a divided Interstate highway section.
Value_Text: No entry required. Available for State Use.
Value_Date: No entry required. Available for State Use.
Guidance: The number of lanes reported for this Data Item shall be designated for through-traffic during the off-peak period.
Code the number of through lanes according to the striping, if present, on multilane facilities, or according to traffic use or State/local design guidelines if no striping or only centerline striping is present.
Exclude all ramps and sections defined as auxiliary lanes, such as:
Managed lanes (e.g., High Occupancy Vehicle (HOV), High Occupancy Toll (HOT), Express Toll Lanes (ETL)) operating during the off-peak period are to be included in the total count of through lanes.
This data shall be collected and reported on an annual cycle for all required sections.
For LRS purposes, this Data Item can be reported independently for both directions of travel associated with divided highway sections, for which dual carriageway GIS network representation is required per guidance in Chapter 3, Section 3.3 and Table 3.5. NOTE: This data item is required to be reported for both the inventory and non-inventory directional approaches associated with all divided Interstate roadway sections where the following pavement data items have been reported in the same manner (as specified in the Metadata; see Chapter 3, Sec. 3.3, Tables 3.18 and 3.19):
Please note that Data Items 7, 9, 10 and 11 (Through Lanes, Managed Lanes, Peak Lanes, and Counter-peak Lanes, respectively) contain similar, but unique travel lane information. The distinction between and requirements for these data items and Directional Through Lanes is described in Table 4.6.
Table 4.6: Travel Lane-related Data Reporting Requirements/Specifications
Data Item |
Description |
Reporting Extent |
Peak period Representation |
Directionality |
|---|---|---|---|---|
Directional Through Lanes |
The number of lanes designated for through-traffic, for a given direction of travel. |
Full Extent for divided Interstate sections, where pavement distress items are reported independently for both directions of travel. |
Off-peak |
Report the number of lanes independently for each direction of travel. |
Through Lanes |
The number of lanes designated for through-traffic. |
Full Extent for all Federal-aid system roadway sections, including ramps. |
Off-peak |
Varies depending on the selected pavement distress reporting method (see Chapter 2 - Sec. 2.7, Chapter. 3 - Sec. 3.3 (“Metadata” discussion)), and Chapter 4 - Sec. 4.4 (“Data Item 7” discussion) for guidance). |
Managed Lanes |
The maximum number of lanes designated for managed lane operations. |
Full Extent for all Federal-aid system roadway sections, where applicable. |
Peak and Off-peak |
Report the total number of lanes in both directions of travel. |
Peak Lanes |
The number of lanes in the peak direction of flow during the peak period. |
Sample Panel Sections |
Peak |
Report the number of lanes associated with the peak direction of flow only. |
Counter Peak Lanes |
Number of lanes in the counter-peak direction of flow during the peak period. |
Sample Panel Sections |
Peak |
Report the number of lanes associated with the counter-peak direction of flow only. |
This section describes the data fields required for reporting the location of the Sample Panel Sections within the State’s Table of Potential Samples (T.O.P.S.). Detailed Information on the sampling procedures associated with the T.O.P.S. is contained in Chapter 6.
The fields of information listed in Table 4.7 are to be submitted as part of the Sample Panel Identification dataset which will be stored in the Sections Catalog (discussed in Chapter 3).
Field Number is the number assigned to each data field for reference purposes.
Table 4.7: HPMS Sample Panel Identification File Structure
Field Number |
Field Name |
|
|---|---|---|
Sample Panel Section |
1 |
Year_Record |
2 |
State_Code |
|
3 |
Route_ID |
|
4 |
Begin_Point |
|
5 |
End_Point |
|
6 |
Section_Length |
|
7 |
Sample_ID |
|
8 |
Comments (Optional) |
The next section describes the detailed specifications for the fields identified in Table 4.7, in terms of their Descriptions, Usage, Data Formats, Coding instructions, and Guidance (where applicable) for each Field.
Description: The calendar year for which the data is applicable.
Use: For identifying the representative year of the data.
Data Type: Numeric (Integer)
Coding: Enter the four digits for the calendar year that the data represents.
Guidance: N/A
Description: The State Federal Information Processing Standard (FIPS) code.
Use: For identifying the State for which the data is being reported.
Data Type: Numeric (Integer)
Coding: Enter up to two digits for the State FIPS code. See Appendix C for a complete list of FIPS codes.
Guidance: N/A
Description: The unique identifier for a given roadway (i.e., route).
Use: For identifying the specific route for which the data is being reported.
Data Type: Text
Coding: Enter an alphanumeric sequence consisting of no more than 120 characters.
Guidance: The Route ID is to be developed per the States’ preference. However, this ID shall be consistent with the Route ID schema that is contained in the State’s LRS network attribute data.
Description: The point of origin for a given section of road.
Use: For identifying the beginning point of a section for spatial referencing purposes.
Data Type: Numeric (Decimal (8,3))
Coding: Enter a decimal value to the nearest thousandth of a mile.
Guidance: N/A
Description: The terminus point for a given section of road.
Use: For identifying the ending point of a section for spatial referencing purposes.
Data Type: Numeric (Decimal (8,3))
Coding: Enter a decimal value to the nearest thousandth of a mile.
Guidance: N/A
Description: The true length (i.e., measured length) for a given section of road.
Use: For analysis and comparison of various data items for apportionment, administrative, legislative, analytical, and national highway database purposes.
Data Type: Numeric (Decimal (8,3))
Coding: Code the length in decimal format to the nearest thousandth of a mile.
Guidance: Refer to guidance provided in Section 4.2 for Data Field No. 7 in the Sections dataset.
Description: A unique identifier for the section.
Use: For identifying a section that is within the defined limits of the Sample Panel.
Data Type: Text
Coding: Enter an alphanumeric sequence consisting of no more than 12 characters.
Guidance: N/A
Description: Additional information for State use (formerly referred to as the “State Control Field”).
Use: For storing supplemental information provided by the States which is used to manage their various databases.
Data Type: Text
Coding: This item can be coded as variable text up to 100 characters, in accordance with the State’s needs.
Guidance: The information provided in this field is not required by FHWA.
Within the scope of the Sections data in HPMS, there are data items that either are currently coded by FHWA, or will be at some point in the future. For reference purposes, Table 4.7 lists these items. FHWA will assign default codes to the items shown with a single asterisk (*) if the States do not provide this information. In addition, the items shown with a double asterisk (**) will be coded by FHWA (at some point in the future) based on updates that are provided by the States to FHWA’s Office of Planning. Only FHWA-approved updates will be used to code Data Items 64-67.
Table 4.7 FHWA Coded Items
Item Number |
Data Item |
|
FHWA Coded Items |
61 |
Climate Zone* |
|---|---|---|
62 |
Soil Type* |
|
64 |
National Highway System (NHS)** |
|
65 |
STRAHNET** |
|
66 |
National Truck Network** |
|
67 |
Future Facility** |
The next section provides the detailed specifications for the data items identified in Table 4.7.
Description: Climate zone as defined by the 4 LTPP climate zone descriptions.
Use: For the cost allocation pavement model.
Coding: This will be coded according to the four FHWA Long Term Pavement Performance (LTPP) climate zone descriptions as follows:
Code |
Description |
|---|---|
1 |
Wet-Freeze |
2 |
Wet-Non Freeze |
3 |
Dry-Freeze |
4 |
Dry-Non Freeze |
Description: Soil type as defined by AASHTO soil classes.
Use: For pavement modeling purposes.
Coding: This will be coded AASHTO soil class data.
Description: The FHWA-approved NHS, including intermodal connectors, and the month and year it was approved
Use: For establishing the official National Highway System.
Coding: This item will be coded for all sections that either are located on the NHS or function as NHS connectors to -intermodal facilities, using one of the following codes:
Code |
Description |
|
|---|---|---|
1 |
Not NHS Connector |
A designated NHS Route |
2 |
NHS Connector to |
Airport |
3 |
Port Facility |
|
4 |
Amtrak Station |
|
5 |
Rail/Truck Terminal |
|
6 |
Inter City Bus Terminal |
|
7 |
Public Transportation or Multimodal Passenger Terminal |
|
8 |
Pipeline Terminal |
|
9 |
Ferry Terminal |
|
Description: The Strategic Highway Network (used for Department of Defense purposes).
Use: For identifying the STRAHNET system.
Coding: This item will be coded using the following codes:
Code |
Description |
|---|---|
1 |
Regular STRAHNET |
2 |
Connector |
Description: Highway sections that comprise the National Truck Network as defined by 23 CFR 658, Appendix A.
Use: For freight modeling and analysis.
Coding: This item will be coded using the following codes:
Code |
Description |
|---|---|
1 |
Section is on the National Truck Network |
2 |
Other State designated truck routes |
Description: The pending (planned/un-built) NHS, including intermodal connectors.
Use: For identifying the National Highway System.
Coding: This item will be coded using the following code:
Code |
Description |
|---|---|
1 |
This is an un-built NHS section |
In addition to the items that will be coded by FHWA, there is a limited group of data items that will be calculated by the HPMS software once the data has been submitted. These items and the extent for which they will be calculated are listed in Table 4.8 below.
Table 4.8: Software Calculated Items
Data Item |
Extent |
||
|---|---|---|---|
Software Calculated Items |
Volume Group |
FE |
|
Expansion Factor |
SP |
||
Horizontal Alignment Adequacy |
SP* |
||
Vertical Alignment Adequacy |
SP* |
||
Weighted Design Speed |
SP |
||
Computed Capacity |
SP |
||
Volume/Service Flow Ratio |
SP |
||
SP = All Sample Panel Sections (as defined by HPMS) SP* = Some Sample Panel Sections, see Data Item details |
|||
The next section provides the detailed specifications for the data items identified in Table 4.8.
Description: A value that is associated with a defined range of values, used to classify an AADT value.
Use: For apportionment, administrative, legislative, analytical, and national highway database purposes.
Extent: All Federal-aid highways.
Functional System |
1 |
2 |
3 |
4 |
5 |
6 |
7 |
|
|---|---|---|---|---|---|---|---|---|
NHS |
IH |
OFE |
OPA |
MiA |
MaC |
MiC |
Local |
|
Rural |
FE |
FE |
FE |
FE |
FE |
FE |
||
Urban |
FE |
FE |
FE |
FE |
FE |
FE |
FE |
|
FE = Full Extent SP = Sample Panel Sections |
||||||||
Coding: This item will be coded based on the reported AADT, using the following codes:
Code |
Description |
|---|---|
1 |
Under 500 |
2 |
500 – 1,999 |
3 |
2,000 – 4,999 |
4 |
5,000 – 9,999 |
5 |
10,000 – 19,999 |
Code |
Description |
6 |
20,000 – 34,999 |
7 |
35,000 – 54,999 |
8 |
55,000 – 84,999 |
9 |
85,000 – 124,999 |
10 |
125,000 – 174,999 |
11 |
175,000 – 249,999 |
12 |
250,000 and more |
Description: The ratio of the total length in a volume group to the total sampled volume group length.
Use: For expanding sampled data to represent the Full Extent from which the sample is drawn.
Extent: All Sample Panel sections.
Functional System |
1 |
2 |
3 |
4 |
5 |
6 |
7 |
|
|---|---|---|---|---|---|---|---|---|
NHS |
IH |
OFE |
OPA |
MiA |
MaC |
MiC |
Local |
|
Rural |
SP |
SP |
SP |
SP |
SP |
SP |
||
Urban |
SP |
SP |
SP |
SP |
SP |
SP |
SP |
|
FE = Full Extent SP = Sample Panel Sections |
||||||||
Coding: This item will be calculated and coded using the volume group information in Data Item 1 (Volume Group).
Calculation:Expansion Factor =Total length in the Volume Group
Sampled length in the Volume Group
If the expansion factor for a volume group exceeds 100.000, select additional Sample Panel sections from the Full Extent volume group until the expansion factor is reduced to a maximum of 100.000. If there are fewer than three samples in a volume group (minimum requirement) and additional sections are available, select additional samples from the Full Extent volume group.
Chapter 6 contains a description of the standard sample selection and maintenance scheme.
Description: The adequacy of horizontal alignment when curve data are not reported.
Use: For investment requirements modeling to estimate horizontal alignment deficiencies and for the truck size and weight analyses.
Extent: All rural paved Sample Panel sections, unless Data Item 43 (Curves) is coded for the section.
Functional System |
1 |
2 |
3 |
4 |
5 |
6 |
7 |
|
|---|---|---|---|---|---|---|---|---|
NHS |
IH |
OFE |
OPA |
MiA |
MaC |
MiC |
Local |
|
Rural |
SP |
SP |
SP |
SP |
||||
Urban |
||||||||
FE=Full Extent SP = Sample Panel Sections |
||||||||
Coding: This item will be calculated and coded using the following codes:
Code |
Description |
|---|---|
0 |
Curve data are reported or this item is not required for the section. |
1 |
All curves meet appropriate design standards for the type of roadway. |
2 |
Some curves are below appropriate design standards but all curves can be safely and comfortably negotiated at the prevailing speed limit on the section. The speed limit was not established by the design speed of curves. |
3 |
Infrequent curves with design speeds less than the prevailing speed limit on the section. Infrequent curves may have reduced speed limits for safety purposes. |
4 |
Several curves uncomfortable or unsafe when traveled at the prevailing speed limit on the section or the speed limit on the section is severely restricted due to the design speed of curves. |
Description: The adequacy of vertical alignment when grade data are not reported.
Use: For investment requirements modeling to estimate vertical alignment deficiencies.
Extent: All rural paved Sample Panel sections unless Data Item 45 (Grades) is coded.
Functional System |
1 |
2 |
3 |
4 |
5 |
6 |
7 |
|
|---|---|---|---|---|---|---|---|---|
NHS |
IH |
OFE |
OPA |
MiA |
MaC |
MiC |
Local |
|
Rural |
SP |
SP |
SP |
SP |
||||
Urban |
||||||||
FE = Full Extent SP = Sample Panel Sections |
||||||||
Coding: This item will be calculated and coded using the following codes:
Code |
Description |
|
|---|---|---|
0 |
Grade data are reported or not required |
|
1 |
All meet design standards |
All grades (rate and length) and vertical curves meet minimum design standards appropriate for the terrain. |
2 |
Some meet design standards |
Some grades (rate and length) and vertical curves are below appropriate design standards for new construction; all grades and vertical curves provide sufficient sight distance for safe travel and do not substantially affect the speed of trucks. |
3 |
Infrequent grades |
Infrequent grades and vertical curves that impair sight distance or affect the speed of trucks (when truck climbing lanes are not provided). |
4 |
Frequent grades |
Frequent grades and vertical curves that impair sight distance or severely affect the speed of trucks; truck climbing lanes are not provided. |
Description: The design speed weighted by the length of individual horizontal curves and tangents on a section.
Use: For investment requirements modeling to calculate capacity and estimate needed capacity improvements.
Extent: All Sample Panel sections.
Functional System |
1 |
2 |
3 |
4 |
5 |
6 |
7 |
|
|---|---|---|---|---|---|---|---|---|
NHS |
IH |
OFE |
OPA |
MiA |
MaC |
MiC |
Local |
|
Rural |
SP |
SP |
SP |
SP |
SP |
SP |
||
Urban |
SP |
SP |
SP |
SP |
SP |
SP |
SP |
|
FE = Full Extent SP = Sample Panel Sections |
||||||||
Coding: When curve data are not provided, a default value based upon functional system and facility type will be used, as shown in the following table:
Roadway Type |
Functional System Code |
|||||||||||
|---|---|---|---|---|---|---|---|---|---|---|---|---|
Rural |
Urban |
|||||||||||
1 |
2 |
3 |
4 |
5 |
6 |
1 |
2 |
3 |
4 |
5 |
6 |
|
Multilane Divided |
70 |
70 |
70 |
70 |
65 |
70 |
70 |
70 |
60 |
55 |
55 |
|
Multilane Undivided |
70 |
70 |
70 |
70 |
60 |
70 |
70 |
70 |
55 |
45 |
45 |
|
2/3 Lane |
70 |
70 |
70 |
65 |
60 |
70 |
65 |
65 |
55 |
45 |
45 |
|
Description: The capacity of the roadway as estimated by the HPMS software provided that the State has not reported this information.
Use: For investment requirements modeling to calculate capacity, the cost allocation pavement model, and congestion, delay, and other analyses.
Extent: Sample Panel sections for which capacity data has not been reported by the State.
Functional System |
1 |
2 |
3 |
4 |
5 |
6 |
7 |
|
|---|---|---|---|---|---|---|---|---|
NHS |
IH |
OFE |
OPA |
MiA |
MaC |
MiC |
Local |
|
Rural |
SP |
SP |
SP |
SP |
SP |
SP |
||
Urban |
SP |
SP |
SP |
SP |
SP |
SP |
SP |
|
FE = Full Extent SP = Sample Panel Sections |
||||||||
Coding: The capacity of a roadway facility is the maximum reasonable hourly rate at which vehicles can be expected to transverse a point or a uniform section of lane or roadway during a given time period under prevailing roadway, traffic, and control conditions. Reasonable expectancy is that the stated capacity can be achieved repeatedly. The Highway Capacity Manual provides procedures, formulas, graphics, and tables in assessing roadway capacity.
This item will be computed and coded based on procedures used in the HPMS software which are consistent with the Highway Capacity Manual (HCM).
All urban and rural capacity for freeways and other multilane facilities is for the peak direction (ensuring capacity from reversible lanes is included). If a rural facility has 2 or 3 lanes with one-way operation, it is considered to be a multilane facility for determining capacity. The capacity for rural facilities with 2 or 3 lanes and two-way operation is for both directions.
The Computed Capacity is only for sample sections which lack State-provided Capacity (Data Item 69) in order to ensure complete data. State-provided capacities are superior estimates because the State has access to more detailed information than is available through HPMS.Description: A computed value reflecting peak hour congestion.
Use: For investment requirements modeling to estimate needed capacity improvements, in the national highway database, and for congestion, delay, and other data analyses.
Extent: All Sample Panel sections.
Functional System |
1 |
2 |
3 |
4 |
5 |
6 |
7 |
|
NHS |
IH |
OFE |
OPA |
MiA |
MaC |
MiC |
Local |
|
Rural |
SP |
SP |
SP |
SP |
SP |
SP |
||
|---|---|---|---|---|---|---|---|---|
Urban |
SP |
SP |
SP |
SP |
SP |
SP |
SP |
|
FE = Full Extent SP = Sample Panel Sections |
||||||||
Coding: States are not able to override this value, but are encouraged to verify data items that affect this calculation.
If the volume to service ratio is 1.40 or higher, the measurement and coding of items that affect peak capacity should be inspected.
Items that affect capacity (listed from most to least critical) are:
Less significant items that affect capacity are:

