U.S. Department of Transportation
Federal Highway Administration
1200 New Jersey Avenue, SE
Washington, DC 20590
202-366-4000
The purpose of this chapter is to address the selection and maintenance of the HPMS Sample Panel, and to explain how the geospatial component of the HPMS data model supports these processes. The data reported in HPMS for sampled roadway sections are a source of the condition, use, and operational information pertaining to the nation’s roadways. For analysis purposes, Sample Panel data are expanded to represent the Full Extent of roadways in the HPMS. This data is ultimately used for monitoring trends and impacts in performance data over time, and for analyses in support of national budgeting for highway improvements through the Conditions and Performance (C&P) report to Congress. Therefore, the selection and maintenance of adequate, up-to-date HPMS samples is a high priority, annual requirement.
This chapter also discusses the AADT and Volume Group Ranges and their impact on the sample selection process, and the sample size estimation procedures and methods used to determine sample adequacy. Chapters 3 and 4 described the HPMS Data Model, and the specific requirements for the Full Extent and Sample Panel data. The following section describes the Table of Potential Samples (TOPS) (see Appendix B, Glossary), and explains how it is to be used for sample selection purposes.
Statistically speaking, a universe is a population from which a sample is taken. A population can be any set of sampling units, such as objects that can be observed or people who can be surveyed. A sampling frame is a list of all of the sampling units in a universe. The universe for HPMS is all public roads. A sampling unit in HPMS is a particular kind of highway section and the Table of Potential Samples (TOPS) is the sampling frame. An HPMS sample panel is a selection of sections from the TOPS stratified by a defined set of traffic volume groups. Stratification is done to improve the precision of the estimates without significantly increasing the sample size.
The TOPS includes all Federal-aid highways, which are highways on the National Highway System (NHS) and all other public roads not classified as local roads or rural minor collectors. Some data items in HPMS are reported for all Federal-aid highways; these are called Full Extent data items. However, road sections used for Full Extent data items do not need to align with the TOPS. It is important to note that once the sample panel is chosen, then the State must provide data for every sampled data item in the sample panel.
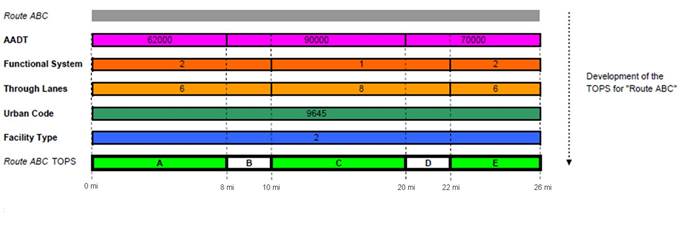
The TOPS is developed based on the geospatial intersection of five key data items (AADT, Functional System, Urban Code, Through Lanes, and Facility Type) where their respective values are homogenous (i.e. unchanged) for defined extents along a given route. Figure 6.1 shows the development of TOPS sections for a given route (“Route ABC”) based on the aforementioned homogenous data items. Once the TOPS has been established, samples are selected at random from the TOPS (e.g. Sections A, B, and C in Figure 6.1).
Figure 6.1 TOPS Development Process
For HPMS purposes, there are three types of data items: (1) those that are required to be reported for the Full Extent of the Federal-aid highways (with possible additions and exceptions), (2) those that are required to be reported for only on the HPMS Sample Panel (with possible exceptions), and (3) those that are required to be reported on a Full Extent basis for some highway systems and on a Sample Panel basis for other highway systems. These data item types are referred to as Full Extent, Sample Panel, and Partial Extent, respectively.
The following list uses the terms “extent” and “coverage” to illustrate the difference between Full Extent and Sample Panel data as it pertains to each of the listed data elements. The term “extent” describes the types of roadways for which the data item is to be collected. The term “coverage” describes the highway sections for which the data item must be reported. The minimum coverage for each data item is Full Extent, Sample Panel, or Partial Extent:
Data Element Extent Coverage
AADT Federal-aid highways and ramps Full Extent
Access Control Principal arterials and sample sections Partial Extent
Ownership Federal-aid highways Full Extent
Route Signing Federal-aid highways except urban collectors Full Extent
Peak Lanes Federal-aid highways Sample Panel
Terrain Type Rural Federal-aid highways Sample Panel
Signal Type Urban Federal-aid highways Sample Panel
An HPMS section record represents a single data item and its corresponding value for a “section” of road. However, with few exceptions, it is not necessary that the section record have the same begin and end points matching a section in the TOPS, provided that the required coverage is accounted for. The section records that are reported for the following data items must have begin and end points that align with the limits of a TOPS section:
Upon upload of the States’ Section data, the HPMS software will subsequently generate the TOPS. The TOPS will then be used for sample selection purposes and to validate the Sample Panel attributes. Also, a TOPS that is generated based on the data submitted in one year may be used in the next year for sampling purposes, except where there is a change in the limits for one or more of the required homogenous data items.
Since travel patterns within a State are dynamic and tend to vary by area type (e.g. rural, small urban, and urbanized areas), the HPMS sample selection process also changes to accommodate this fluctuation in travel patterns.
HPMS uses 12 volume groups for stratification purposes. The stratification process used for AADT data produces estimates of greater accuracy for the sample data items, when a smaller number of samples at the functional system (summation) level.
The AADT volume groups for rural, small urban, and urbanized areas, are the same for all sampled functional systems. The sampled functional systems include: Interstates, Other Freeways and Expressways, Other Principal Arterials, Minor Arterials, Major Collectors, and Urban Minor Collectors. The volume group ranges to be used for stratification purposes are listed in Table 6.1.
Table 6.1 Volume Group/AADT Ranges
Volume Group |
AADT Ranges |
|---|---|
1 |
Under 500 |
2 |
500 to 1,999 |
3 |
2,000 to 4,999 |
4 |
5,000 to 9,999 |
5 |
10,000 to 19,999 |
6 |
20,000 to 34,999 |
7 |
35,000 to 54,999 |
8 |
55,000 to 84,999 |
9 |
85,000 to 124,999 |
10 |
125,000 to 174,999 |
11 |
175,000 to 249,999 |
12 |
250,000 and more |
There is a direct correlation between functional system and a precision level as shown in Table 6.2.
The term precision level is defined as “the degree of accuracy resulting from the use of a statistical sample”. For example, if a sample is designed at the 90-10 confidence interval and precision rate, the resultant sample estimate will be within ±10 percent of the true value, 90 percent of the time.
There are precision levels defined, for the purposes of HPMS, which apply to each Functional System listed in Table 6.2. A statistical formula is used to determine the estimated required number of samples needed to meet the target precision level, within each volume group for a given Functional System. This formula is discussed in Section 6.4.
The size of the HPMS sample is based on three components: (1) the variability (i.e. coefficient of variance) of AADT within a volume group, (2) the functional system confidence interval and precision level, and (3) the number of TOPS sections in a volume group, available for sampling.
Sample size requirements by functional system will vary from State to State according to the total number of TOPS sections, the number of predetermined volume groups, the validity of the State’s AADT data, and the desired precision level. The HPMS sample size requirements are more stringent for the principal arterial systems, where a higher level of precision is needed due to their national significance.
Typically, the State-wide summation of individual urbanized functional system data element estimates will result in an overall precision level of at least 80-10 (or 70-15 for States having three or more urbanized areas with population < 200,000).
Higher precision is necessary to obtain comparable urban and rural precision levels, on a State-wide basis, and to obtain precision levels that can adequately accommodate desired levels of accuracy for estimates of proportionate values as well as average and aggregate values. That is, although the HPMS sample is designed to measure AADT, the same samples are used to estimate the proportionate values for other types of data such as pavement condition. The level of accuracy for estimated proportions is closely related to sample size. Therefore, precision levels have been set high enough to produce reasonable proportionate estimates at the functional system level. It is important to remember that the absence of Sample Panel data, where it is required to be reported, will degrade the sample precision.
The required precision levels are listed in Table 6.2.
Table 6.2 Precision Levels
Interstate |
Other Freeways and Expressways |
Other Principal Arterial |
Minor |
Major |
Minor |
|
|---|---|---|---|---|---|---|
RURAL |
90-5 |
90-5 |
90-5 |
90-10 |
80-10 |
– |
SMALL URBAN |
90-5 |
90-5 |
90-5 |
90-10 |
80-10 |
80-10 |
URBANIZED |
80-10 |
80-10 |
80-10 |
80-10 or |
80-10 or |
80-10 or |
URBANIZED |
90-10 |
90-10 |
90-10 |
90-10 |
80-10 |
80-10 |
*These precision levels will be applied if a State has three or more urbanized areas with a population < 200,000.
This section describes how the sample size estimates for each stratum, with a desired confidence level, can be derived using an estimation formula and/or the HPMS software. The formula and each of its input variables are described below.
Sample Size Estimation formula:

Where:
n = Required sample size
Z = Value of the standard normal statistic for an alpha confidence level (two-sided):
Table 6.3 Confidence Level
Confidence Level |
Value of Z |
Z Squared |
|---|---|---|
90 Percent |
1.645 |
2.706 |
80 Percent |
1.282 |
1.644 |
70 Percent |
1.040 |
1.082 |
C = AADT coefficient of variation from a State’s AADT data
d = Desired precision rate (from Table 6.2)
N = TOPS or population stratum size (number TOPS sections available for sampling in a volume group)
For example, the sample size for a stratum with a desired precision rate of +/-5 percent and a 90 percent confidence level, an AADT coefficient of variation of 0.40, and 300 available TOPS sections for sampling, is estimated by:
 required samples
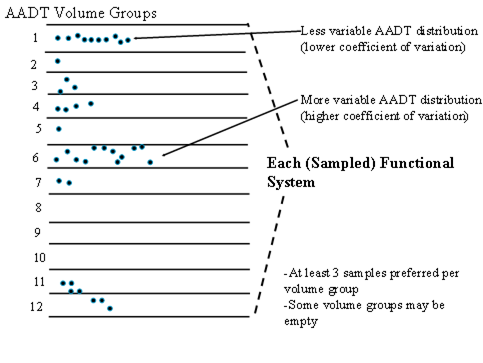
Figure 6.2 illustrates the potential degrees of variability of AADT data by volume group with respect to each sampled functional system. Each dot represents an AADT record in the Sample Panel. In this example, less variation in the AADT distribution for samples (as shown in volume group 1) produces a lower coefficient of variation, while more variation in the AADT distribution (as shown in volume group 6) produces a higher coefficient of variation. Note that empty volume groups may exist across functional systems, (e.g. volume groups 8, 9, and 10). However, if three samples or fewer exist in a given volume group, then all three must be used for sampling purposes (minimum requirement).
Figure 6.2 AADT Volume Groups
The critical point in this process is the value designation of C, the AADT coefficient of variation. The procedures presented in this discussion require an estimation of AADT coefficients of variation based on the latest State data. This approach ensures that the results are up to date, based on the latest information, and are tailored to the specific State.
Estimates of the AADT coefficients of variation for a particular State can be derived from its existing HPMS data using standard statistical software packages. Note, the coefficients of variation will be generated via the HPMS software, which uses a State’s Full Extent data as inputs to standard statistical procedures, and produces reports that enable the State to analyze and review the HPMS Sample Panel.
The HPMS software is also capable of identifying the location potential sample sections using a GIS-based spatial analysis procedure. The TOPS will be created via the software, which will then be made available to the States (via the HPMS software) for sample selection purposes. Furthermore, the software uses the TOPS to calculate and determine the number of samples required in each volume group. There are a number of advantages to leveraging the GIS component of the data model for sampling purposes, which are explained in more detail in the next section on Sample Adequacy and Maintenance.
Each HPMS section should be relatively homogeneous as to geometrics, traffic volume, cross-section, and condition, and should be long enough to constitute a logical section for National-level analysis purposes.
In general:
These suggested lengths are intended to normalize the sample data at a national level. Shorter sections may be warranted where there are breaks in homogenous roadway elements. Conversely, longer sections reduce the number of TOPS sections and result in a somewhat smaller number of initial samples. However, longer sections may need to be split in later years in order to maintain sample homogeneity, which will increase the number of sampling units within the Sample Panel and may result in an increase in the required number of samples.
It is important to precisely document the exact location of each sampled section to assure that yearly and cyclical updates, field reviews, traffic counts, etc., are performed on the appropriate roadway sections.
Sample adequacy and maintenance is a process that should be integrated as part of the routine data management activities of the State throughout the year. Once the State has uploaded HPMS data, the HPMS software will produce the TOPS and this information will be available to the States (as discussed in Section 6.2). The States will need to then review their sample framework to determine the necessary adjustments and add new sample sections as needed, prior to the next HPMS submittal cycle. Some of the guidelines recommended by FHWA for the States to adhere to include the following:
The purpose of the HPMS Sample Panel is to provide an expandable base for rural, small urban and urbanized area data in each State, stratified by functional system and traffic volume group. An expansion factor is calculated for each volume stratum within each functional system. This is accomplished by dividing the total miles in the stratum by the miles included in that stratum’s sample. States are encouraged to not exceed a maximum expansion factor of 100.000; otherwise, it is possible that the TOPS would be too sparse for adequate representation. States must avoid having no sample in a traffic volume group with mileage in the State, because that traffic volume group cannot be expanded and the mileage is missing.
Figure 6.3 illustrates the Expansion Factor calculation, using the Full Extent and Sample Panel lengths, and the effect of excessively short Sample Panel lengths.
Figure 6.3 Expansion Factor
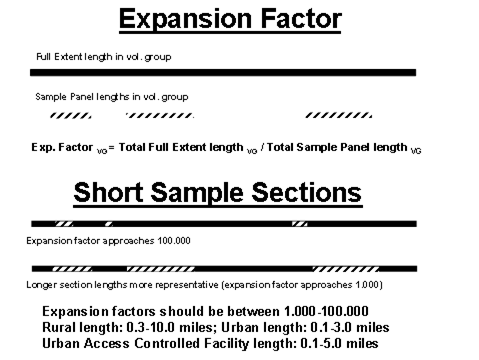
As shown in the top part of Figure 6.3, the total Full Extent length in each stratum is a known value based on the AADT volume group identifier. Expansion factors are calculated by the HPMS software for each sample section. The expansion factor allows sample data to be expanded to represent entire functional systems for rural, small urban and urbanized areas. The lower part of the figure illustrates that if there is a prevalence of short Sample Panel sections in a given volume group, the net effect is an expansion factor that will approach or exceed 100.000. Note that a prevalence of longer Sample Panel sections in a volume group will thus have the effect of lowering the expansion factor towards or equaling 1.000.
Both rural and small urban area data are to be sampled on a statewide basis, and stratified only by functional system and volume group. The volume group for each roadway section in the sampling frame will be identified in the HPMS software, according to Table 6.1. The number of sections to be included in the sample is determined using the calculation procedure described in Section 6.4. A minimum of three sample sections is required for each volume group. If less than three TOPS sections exist in a volume group; it is recommended that they all be sampled, which will result in an expansion factor of 1.000. Sections should be selected randomly within each volume group for a given functional system, until the required number of samples is reached.
Urbanized area data are sampled on an individual area basis stratified by functional system and volume group. Each State must individually sample urbanized areas regardless of population size. The volume group for each roadway section and the required precision levels in the sampling frame must be identified according to Table 6.1 and Table 6.2, respectively, before sample selection can begin.
The number of sections to be included in the sample is determined using the calculation procedure described in Section 6.4. As with rural and small urban areas, sections should be selected randomly within each volume group for a given functional system, until the required number of samples is reached.
Each State must sample its portion of a multi-State urbanized area individually; an individual sampling approach must be applied to all parts of multi-State urbanized areas if expanded estimates are needed for the entire urbanized area.
An HPMS sample adequacy review should be performed annually as part of a State’s sample maintenance activities. The review should be completed shortly after the annual submittal of the HPMS dataset to address any potential deficiencies, prior to the next annual submittal. This permits the data provider to assess the adequacy of the sample framework (i.e. TOPS), which allows enough time for changes to be made in preparation for the next reporting cycle. Timing of the State’s HPMS data processing is an important issue since sampling is dependent to a certain degree upon up-to-date traffic and functional classification data. There should be a number of considerations when reviewing HPMS sample adequacy. These considerations should include not only the assessment of the number of samples per volume group, but also a check for potential sample biases.
When conducting a sampling review, the State should also check for biases that may have been inadvertently introduced into the sample. As a result, sample bias may have been introduced in areas such as samples on State versus non-State-owned roads, sub-area biases by highway district, county, or non-random selection of adjacent roadway sections as new samples. Some of these biases may be disclosed by comparing the number of miles sampled. For example, the percent of State-owned miles sampled could be compared with the percent of non-State-owned miles sampled. Others may require a more detailed examination of the sample and its distribution. For instance, are samples clustered in groups on the same facility? A periodic review of the sample provides an opportunity to identify if any of these problems exist. As further changes are made to the HPMS sample, any biased sample selection procedures should be eliminated to improve sample randomness.
There are any numbers of occurrences that may result in a need to reconsider the suitability of the existing Sample Panel. Some of the more common reasons for considering Sample Panel adjustments include:
A thorough sample adequacy review, conducted annually, provides an opportunity to update the HPMS Sample Panels when necessary to meet the changed conditions reflected above.
Sample Panel adjustments should be made as necessary upon completion of a sample adequacy review. Use of an annual cycle will minimize the burden of completing this task. The following general procedures should be considered when adjusting Sample Panels:
When small urban or urbanized areas decrease in size, changes to small urban or rural Sample Panels will occur. Therefore, Sample Panel sections affected by such changes should be assigned correctly in the new panel.
Geospatial data can be used as reference information for the purpose of making adjustments to the Sample Panel. States can overlay existing rural and urban geospatial boundary data on the routes spatial data to identify potential sample sections located in a given area. The States will then have the option to code rural/urban area information for their section data based on the boundary data. However, the States will need to ensure that this data is accurate before using it for coding purposes. Alternatively, the States can manually code this information for their section data.
The ability of the HPMS software to generate the TOPS should reduce the amount of time that the States are required to spend selecting new samples. Additionally, the software calculates the number of samples needed in each volume group, using the formula defined in Section 6.4.
The following provides an outline of the steps involved in the preparation of the Sample Panel:
The selection of additional sample sections for a given volume group is straightforward for most Sample Panel updates. The TOPS is generated by the HPMS software. Therefore, the number of existing sample sections can be compared to the required number of samples as determined from the Sample Size Estimation formula, and additional samples can be selected as needed. Again, maintaining accurate AADTs requires the States and other data providers to maintain comprehensive, high quality traffic count programs (see Chapter 5).
Sample sections transferred to other geographic areas become part of the Sample Panel for those areas. Samples may be dropped in cases where a roadway is truly abandoned and not relocated, where sample sections are reclassified to a minor collector (rural) or local functional systems, or where sample sections are dropped from use as a result of a sample reduction plan. When samples are deleted, the State must submit a list specifying the ID numbers for those samples, the reasons for the deletions, and the locations for where the deletions will occur. Significant deletions of samples should be approved by FHWA prior to actual deletion of the samples.
The Sample Panel has been in existence for some time, therefore the addition of samples and the re-assignment Sample Panel sections from one volume group to another are likely to have caused over-sampling in some volume groups. Significant over-sampling is not encouraged because of cost and efficiency impacts. Sample reductions should be considered a normal component of sample maintenance. Before proceeding with a sample reduction exercise, the State should prepare a sample reduction plan and provide it to the FHWA for evaluation. A sample reduction plan should take into account the following:
As part of sample maintenance activities, sample sections should be analyzed to see if they are excessively short in length. Short samples not meeting minimum length recommendations should be lengthened into longer sample sections if they have similar roadway characteristics and the following key data items are homogenous: Urban Code, Functional System, Facility Type, AADT, and Through Lanes. While it is assumed that the TOPS as generated by the HPMS software will produce candidate sample sections based on these items, it is still possible that the resulting lengths may not meet the minimum recommended. In these cases, the AADT should be examined from the perspective of the source data to see if it can be re-calculated based on an extended sample section length that meets length recommendations while maintaining the homogeneity of the other data items. A reduction in an excessive number of short samples may save the State financial and personnel resources, and will ultimately improve sample representation.
For sample sections that are excessively longer than the recommended sample section length, effort should be made to reduce the length of the sample sections by considering subdividing the HPMS software-generated TOPS section(s) in question into one or more sections, based on a homogenous data item that meets the recommended length. In this way, the software-generated TOPS section may be subdivided based on AADT as long as the resulting subdivided section meets the recommended length. However, if no data item changes in value over the excessively long section, there is no need to subdivide the section for HPMS purposes. For example, if a 20 mile rural section is selected from the software-generated TOPS, the section should be subdivided into 2 or more (each not to be less than the minimum length or exceed the maximum) sections based on a non-homogenously-required data item, such as pavement type, if possible.
When updating Sample Panels, any change in sample length and/or the length of the sampling frame requires an update of the expansion factors related to affected volume groups. Expansion factors should be recalculated before the annual HPMS submittal to ensure that all changes to AADT data, whatever the cause, have been properly accommodated. Expansion factor recalculation is one of the final data preparation steps when using the HPMS software.
Table 6.4 provides an overview of conditions which generally require making changes to HPMS Sample Panels. The table lists the changes triggered either directly or indirectly by Bureau of Census actions, and by changes unrelated to Census actions. It should be noted that the impact of the Census’ actions may be minor in nature due to the simplification of the urban/rural area boundary coding process. Furthermore, the table outlines the “Causes” for potential Sample Panel change and the “Recommendations” for how to address the change.
Table 6.4 Sample Panel Change Cause/Recommendation
CAUSE |
RECOMMENDATION |
|---|---|
CENSUS-RELATED |
|
New Small Urban Areas (Rural to Small Urban) |
Adjust all rural sample section records within the new area to urban requirements. Verify statewide rural and small urban area Sample and Full Extent bases and select additional samples as necessary. |
New Urbanized Areas (Small Urban and/or Rural to Urbanized) |
Adjust all rural and small urban area Sample Panel section records within the new area to urbanized area requirements. Procedures for drawing new standard samples for individual panels are discussed above. Verify all Sample Panel and Full Extent bases and select additional samples as necessary. |
Expansion of the Adjusted Boundaries of Small Urban or Urbanized Areas (Rural to Small Urban and Rural and/or Small Urban to Urbanized) |
Adjust all affected rural sample section records to urban requirements. Verify all affected Sample Panel and Full Extent bases and select additional samples as necessary. |
Functional System Reclassification-Any Area |
Reassign reclassified sections (TOPS and Sample Panel) to appropriate areas and volume groups. Sample new sections as necessary to maintain required volume group precision levels. |
Losses in Urban Population |
No action until Census area designation changes. |
Major Revision of Boundaries Based on New Census |
Redraw Sample Panel and include old samples, if possible. |
Changes or Additions to Maintenance Area(s). |
Updates to the samples are made based on the procedures outlined in this chapter. |
NON-CENSUS-RELATED |
|
New Length by Functional System |
Verify Sample Panel and Full Extent base; sample new sections, if necessary. |
Functional System Reclassification in Any Area |
In addition to the movement of sections because of reclassification, there may be a need for possible volume group changes for TOPS and/or Sample Panel sections, precision level changes, and additional samples. |
AADT Reassignment of Sections |
Reassign sample sections but no further action is needed if changes are minor. If changes are major, verify volume group Sample Panel and Full Extent bases for all affected volume groups and add samples, if necessary. |
Expansion Factor |
Recalculate expansion factor values for sample section records in the affected group. |

