City of Moreno Valley, CA
Contact: Jullen Van Simaeys
(951) 413-3151
jullenv@moval.org
 Source: City of Moreno Valley
What was the challenge?
Safety and efficiency are key elements in transportation planning and design. One element in roadway design that has become problematic in recent years is the high rate of speed vehicles travel. Motorist speed and driving habits have become a vital component when planning communities today.
Technology such as mobile devices have inadvertently contributed to an increase of motorists utilizing residential neighborhoods to save time and avoid traffic through the use of traffic assisted applications. This new form of travel has led to higher speeds and increased traffic on local roads designed for lower speeds and traffic volumes. In addition, the increased speeds and traffic volume create dangerous conditions around elementary schools and in residential communities. Motorist driving habits present a challenge for the city.
Transportation technology offers numerous traffic calming measures; however these measures work counterintuitively to the goals of emergency response vehicles. The time required for firefighters to reach an emergency is directly related to the proper installation and maintenance of fire department accessible roadways. It is important to understand the risk associated with traffic calming device installation.
Most types of traffic calming devices slow the fire department's response to an emergency by approximately 3-10 seconds depending on the traffic control device. Every second is critical to the outcome of an emergency response. Complete Streets and Vision Zero goals are gaining support and priority, and traffic calming methods are being utilized to slow drivers down and minimize residential cut-through traffic. However, traditional traffic devices slow both traffic and emergency response services.
The City of Moreno Valley Transportation Engineering Division in collaboration with the City's Fire Department developed an innovative traffic control device to reduce speeding without impacting emergency vehicles response time.
How did you develop and implement your solution?
The City's Transportation Engineering Division staff designed a modified "Speed Cushion" to effectively address this issue. After extensive research and review of approved traffic control devices for speed reduction, numerous meetings with Fire Department officials, and data compiled from the Speed Hump program currently in-place at the city, the information gathered showed speeds were reduced with vertical deflection devices with great success. However, this approach was in direct conflict with the goals of the city's emergency responders.
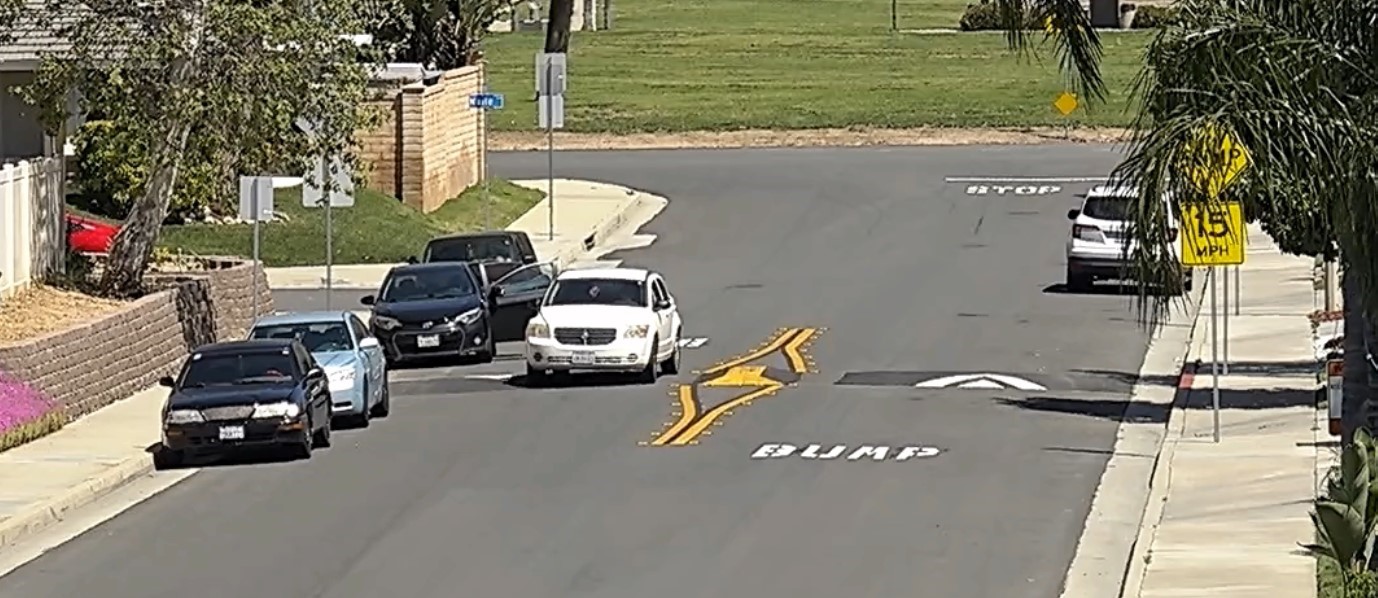
Our modified "Speed Cushion" was designed with the intent to meet both demands. The speed cushion design incorporates various traffic control devices found within FHWA, NACTO, and CAMUTCD guidelines. The modified speed cushion is a hybrid of the devices with some unique modifications. The City's design allows for a greater dual-tire footprint between the center cushion and adjacent cushion to accommodate the entire fleet of emergency response vehicles. These vehicles include the large fire engines which allow for the vehicle to navigate between the cushions with no deflection that toss the Fire Department’s equipment around and slow their response time.
Prior to installation the city created a prototype at our city yard and invited the Fire Department to test the speed cushion with their fleet. The test was successful and approved by Fire Department officials. We next installed two modified speed cushions on a residential street reported to have excessive speeding. The speed cushion is being monitored by the City's transportation engineering staff through a portable camera. A speed survey by road tubes was also conducted with a before and after study, which showed a reduction in speed without a reduction in fire or emergency service response times.
Residential feedback has been overwhelmingly positive and with no crash data reflecting the speed cushion design.
What labor, equipment, plans, or materials did it take to make the solution work?
A center-line diverter stripe was installed to keep standard vehicles from driving over the center cushion. Adjacent to the cushions along the curb, red paint was added to not allow vehicle parking. Creating a buffer space for motorists to travel around the adjacent cushions in the travel lane. The center cushion is painted yellow with reflective beads illuminating the configuration at night for on-coming traffic. The placement of the cushion is placed away from driveways and near a streetlight.
The material used consisted of asphalt concrete, yellow reflective striping paint, red curb paint, pavement markings, raised payment markers (RPMs), advance signs, and other signs. The installation of the "Speed Cushion" was contracted out and the painting/signs were installed by city staff.
What was the cost of implementation?
The unit cost including parts and labor for a speed cushion built from asphalt concrete (A/C) was $5000. Other material such as striping, signs, RPMS, red paint, and labor was provided by city staff at an estimate of $1000.
What was the positive impact/results/outcome?
City stand and results from the modified "Speed Cushion" showed a success in speed reduction with the before and after speed survey. Video monitoring has also shown roadway operations have not been impacted with services from trash, street sweeping, mail delivery, and so on. Residential parking remains ample and with minimal to no residential complaints and emergency response teams have not reported any issues or experienced a reduction in response time.
The success of this design has so far proven the city's goal to reduce speeding and cut-through traffic while not impacting emergency services response.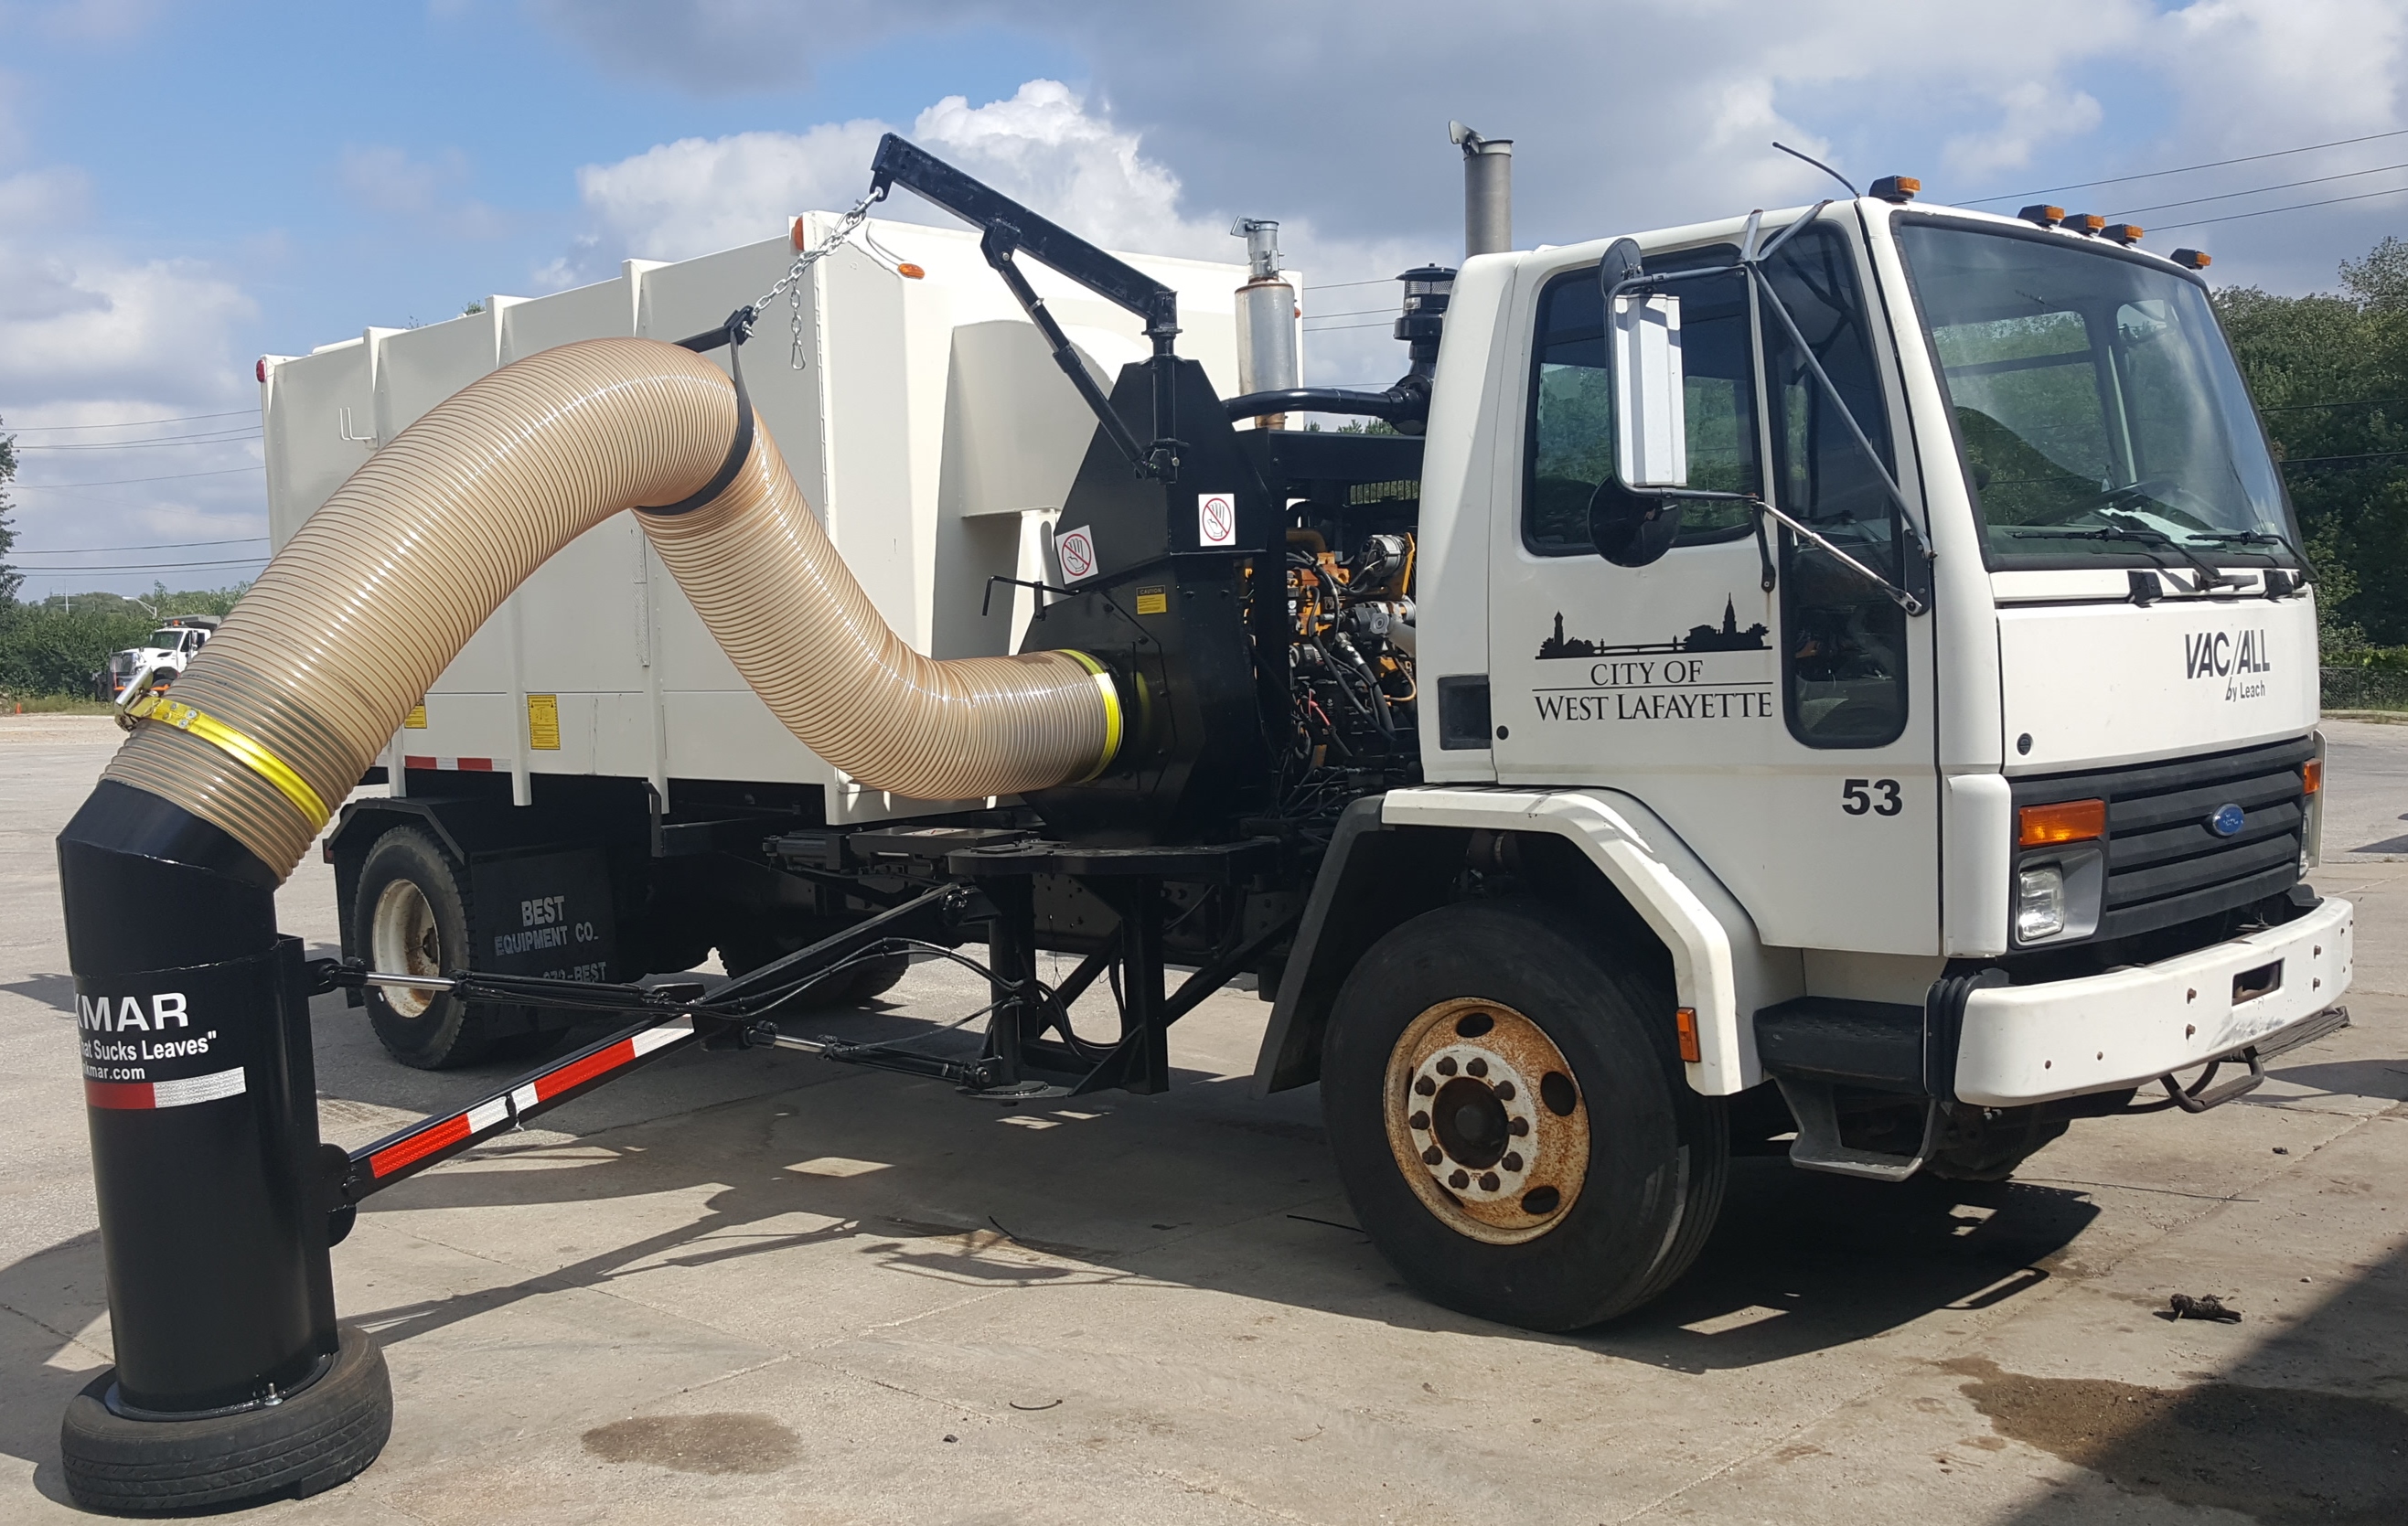 Source: West Lafayette Street and Sanitation Department
West Lafayette Street & Sanitation Department, IN
Contact: Paul Kull
(765) 775-5242
pkull@westlafayette.in.gov
What was the challenge?
Leaf pickup is an important service of the West Lafayette Street and Sanitation Department. Existing leaf vac units were on trailers and took two people to operate; a driver and a leaf vac operator that would stand on the trailer and operate the vac hose. Several challenges were encountered during this process including: the need for two employees to operate with a limited workforce, the safety aspect of the operator on the trailer, the need for a CDL level A to operate the truck and trailer, and the limited funds to purchase equipment when needed.
How did you develop and implement your solution?
To address the challenges of workforce availability, workforce safety, operational efficiency, and cost-effectiveness, the street and sanitation team explored the opportunity to re-purpose a street sweeper chassis. By extending the chassis frame, placing the leaf vac unit on the frame instead of a trailer, and wiring the unit so the leaf vac hose can be operated within the cab of the truck, it allows the driver to be located on the right side of the unit for better visibility of leaf pickup operations. Many used street sweeper units are sold due to street sweeper machine failure. The street sweeper bodies and chassis are generally in good condition and have the same engine configuration as leaf vacs. With the talents of in-house mechanic staff, the department purchased used street sweepers and re-purposed the truck and chassis for leaf vac operations.
What labor, equipment, plans, or materials did it take to make the solution work?
What was the cost of implementation?
A new leaf vac unit cost over $200,000 and the converted unit of a street sweeper to leaf vac machine averaged $10,000 depending on the used street sweeper cost.
We were also able to sell used parts of street sweeper to recoup costs of purchase.
What was the positive impact/results/outcome?
The innovation has reduced workforce needs in half, with only one person required to drive and operate the unit, resulting in a savings of over $16,000 in labor costs per truck. With five trucks in operation, the department has saved $80,000 total in leaf pickup operations.
It has also reduced the need to have CDL level A drivers on staff. Now, units can be operated by a CDL level B driver. Employee safety has increased by having the operators remain in the vehicle (not on the trailer) and located on the curbside of the unit for better visibility of leaf pickup operations.
Town of East Hartford, CT
Contact: Gary Mckeone
(860) 209-8439
gmckeone@easthartforddot.gov
 Source:
Town of East Hartford
Source:
Town of East HartfordWhat was the challenge?
During winter operations we clear a little over 19 miles of sidewalks in East Hartford. We use a Trackless with a plow and sander. The sander holds about 1 yd of material and needs to be constantly refilled. We used to have a dump truck follow the trackless and refill as needed. This would require an employee climb up into the bed of the dump truck and shovel the load into the sander. There were several safety issues with loading our trackless machines during winter operations. First, we had to climb a ladder onto a back of a dump truck during a snowstorm. Next, we would then have to manually shovel 1 yard of material from the truck to the sander of the trackless exposing our staff to the chemicals we use, slips and falls, and ergonomic dangers of shoveling heavy material form a higher point (back of truck) to a lower point (Trackless hopper). We would then climb down the ladder during the storm. With over 19 miles of sidewalk to treat, this needed to be done multiple times during the storm.
How did you develop and implement your solution?
It was a brainstorm solution from our crew. They came up with a way to mechanize the process and reduce manual effort and exposure.
What labor, equipment, plans, or materials did it take to make the solution work?
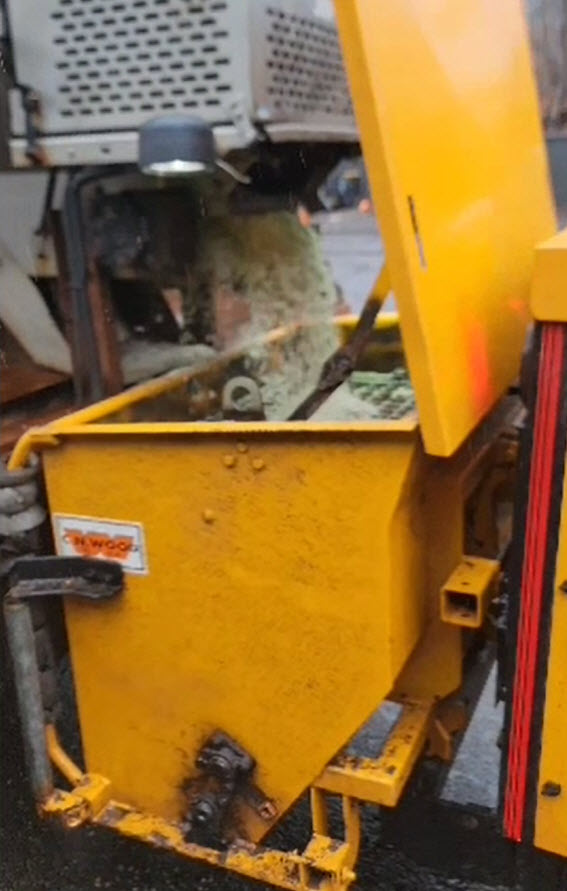
When we were going to retire one of our old sanders, we instead refurbished it and removed the spinner assembly, we then created a chute that dispensed the material straight out in a steady stream. We also raised the sander mountings so it would sit higher in the truck to allow for the Trackless to slide under when refilling. The directional chute allows us to have the trackless backed up to a dump truck. We then fill the trackless by turning on the spreader.
What was the cost of implementation?
$200-500 for the chute material and the labor to fabricate. A great re-purpose of the old sander!
What was the positive impact/results/outcome of your efforts?
The spreader works as planned; it fills the trackless hopper in less than one minute opposed to the longer manual operation in the past. There is less wasted material due to spillage as well, plus we are able to keep the material dry by tarping the spreader. Filling time has been reduced, material loss has been reduced and most importantly the risk to the employee has been removed. No longer does an employee need to climb a snowy ladder into a snow truck to shovel, they merely have to flip a switch inside a warm dry truck cab.McKenzie County Highway Department, ND
Contact: Ralph Bernas
(701) 570-2472
rbernas@co.mckenzie.nd.us
What was the challenge?
 Source: McKenzie County Highway Department
 There are inefficiencies within the department resulting from vehicles in the fleet only being used seasonally. Dump trucks were used primarily in the winter for sanding the roads. In the summer, the semi-tractors with a fifth wheel connection were hooked up to semitrailers and used for hauling gravel. During the winter months the semi-tractors and semitrailers were not used. Dump trucks are used randomly in the summer for hauling small amounts of gravel and dirt.
How did you develop and implement your solution?
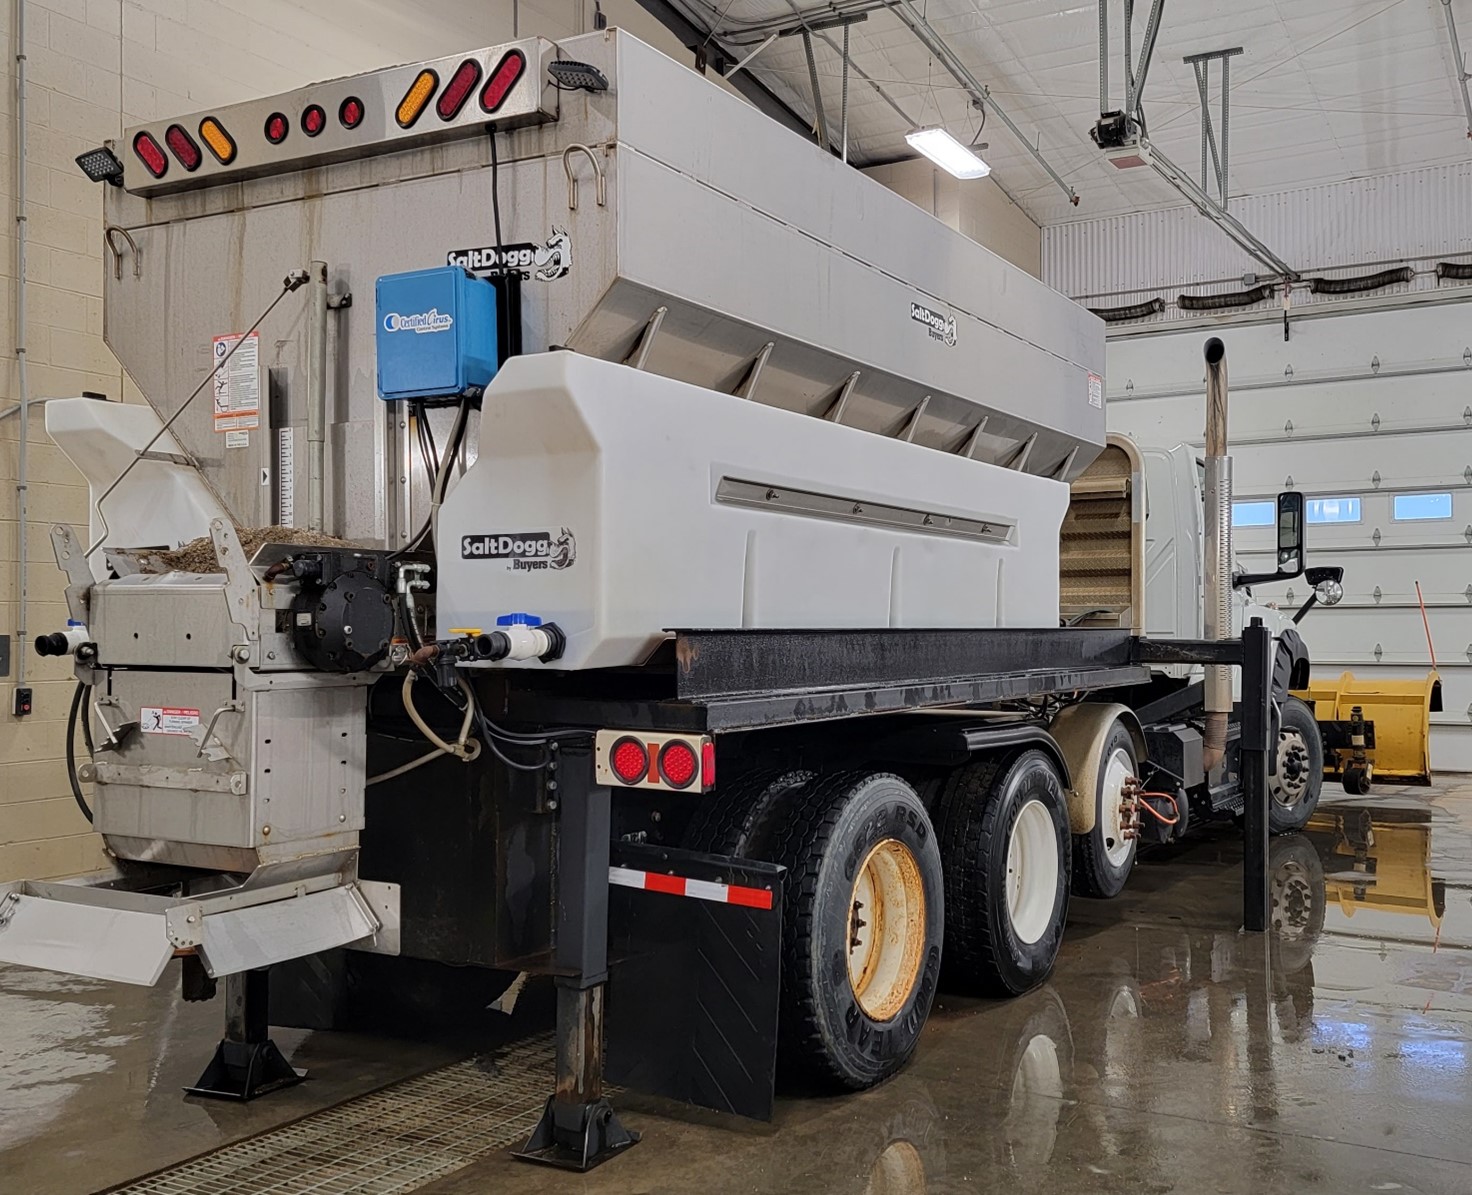
Designed and fabricated the fifth-wheel quick-attach sander. The frame of the quick attach sander sets on the frame of a semi-tractor and is secured with the fifth wheel and king pin connection. The cavity at the rear underside of the sander frame allows the back end of the tractor a snug fit for greater securement.
The frame of the quick-attach sander is fabricated using flat steel, I-beams (serve as frame rail), and square and rectangular tubing. The bed is reinforced with cross beams. The legs (2 - 2”x3” lengths of steel tubing welded together) on each corner can be retracted or lowered with landing gear jacks. The legs can also be extended away from the frame. The legs allow for the quick-attach sander to be free standing so a semi-tractor can easily back under it when needed. Tubing welded on the I-beam serves as a conduit, so hoses are protected. The tank/spreader is welded to the sander frame.
Semi-tractors with the fifth-wheel quick-attach sanders are another means for salting and sanding hazardous roads. In addition, each semi-tractor is also equipped with a plow for removal of snow on the road.
What labor, equipment, plans, or materials did it take to make the solution work?
To successfully implement the solution, a variety of labor, equipment, and materials were essential. The equipment utilized included a band saw, welder, torch, overhead crane, and drill press, all critical for the precision fabrication and assembly of components. Key materials incorporated into the build comprised new steel tubing, square steel tubing, steel sheets, 15-gauge I-beams, flat bars, and black pipe. Additionally, landing gear jacks, bolts, nuts, washers, a king pin, tail light buckets, LED taillights, connector wire, and hydraulic components were integral. Salvaged materials, such as angle iron for electrical wiring support, also played a role.
The project required a total of 160 labor hours from a single individual, encompassing both design and execution phases. The combination of these resources enabled the effective construction and operationalization of the solution.
What was the cost of implementation?
The total cost of implementing the solution was approximately $33,910.01, excluding labor expenses. This includes expenditures for key materials such as steel tubing, rectangular and square steel tubing, steel sheets, 15-gauge I-beams, flat bars, and black pipe. Significant costs were incurred from purchasing landing gear jacks and a stainless-steel sand box with a spinner and motor. Additional costs comprised various hardware components, including bolts, nuts, washers, a king pin, taillight buckets, LED taillights, wiring, and hydraulic parts. This detailed cost breakdown reflects the investment required for material acquisition and preparation.
What was the positive impact/results/outcome of your efforts?
With the fifth-wheel quick-attach sander, the road department is using its semi-tractors year around. When roads are icy, creating hazardous driving conditions, more vehicles are available to apply salt or sand to the roads. More sanders on the road result in safer roads for the traveling public. Each semi-tractor is also equipped with a snowplow for snow removal.
As a result of this innovation, fewer dump trucks are needed. With fewer vehicles requiring maintenance there is savings of time, manpower, and money. The fifth-wheel quick-attach sander is larger than those on dump trucks, so larger volumes of sand and salt are hauled. This reflects a cost savings to the road department and taxpayers. Money that is typically used for buying dump trucks will be used elsewhere. The fifth-wheel quick-attach concept opens the door for utilization of a water tank, hydro seeder box, or car carrier as well.
This innovation also led to key improvements in our annual operating costs. Prior to using the innovation - Only dump trucks were used for sanding icy roads. Semi-trailers were being used only to haul gravel and dirt during the warm weather construction season. During the winter months, semi-trailers were not to be utilized for any type of work.
After using the innovation - The road department does not foresee purchasing additional dump trucks specifically for sanding. They have recently purchased two larger dump trucks. The trucks can be used to pull an end dump semitrailer when hauling gravel. The road department is utilizing their trucks and semi-tractors year around.
Notice
This is disseminated under the sponsorship of the U.S. Department of Transportation in the interest of information exchange. The U.S. Government assumes no liability for the use of the information.
The U.S. Government does not endorse products or manufacturers. Trademarks or manufacturers’ names appear in this report only because they are considered essential to the objective of the information provided.