U.S. Department of Transportation
Federal Highway Administration
1200 New Jersey Avenue, SE
Washington, DC 20590
202-366-4000
The HPMS data model has been developed within a Geographic Information System (GIS) framework, to take full advantage of the spatial relationships that exist between data elements which are both internal and external to HPMS. The data model is designed to be flexible in terms of compatibility with other data sources and expandable as additional data becomes available. In addition, the data model is designed to achieve independence with respect to the way in which the various data components relate to one another. This approach allows for future modification to a particular area of the model (e.g. a dataset, or data item) with little or no impact on other datasets or data items. For instance, if a change is needed to a roadway section’s surface type (e.g. changing it from a code 1-unpaved to code 2-conventional asphalt concrete), it can be done so without impacting the value that is coded for that section’s annual average daily traffic (AADT).
The data model’s design is structured in a way that allows external data sources to be used to populate the various data fields in HPMS. For example, National Ambient Air Quality Standards (NAAQS) boundary spatial data can be used to assign a pollutant standard to each roadway section for the purpose of generating area-wide totals (e.g. vehicle miles of travel).
This data model is organized conceptually into a group of six catalogs. Each catalog groups the various datasets by type and/or function. The types of data can be categorized as: (1) geospatial data, representing various highway systems, geographic boundaries etc., (2) roadway attribute data that can be linked to a related GIS dataset, which allows the attribute data to be represented spatially via linear referencing or (3) metadata, which provides additional global information about the data.
Figure 3.1 illustrates the structure of the HPMS data model. The HPMS attribute data that are submitted by the States are grouped within the Sections Catalog. The Sections dataset that is identified in this catalog stores all of the records for each data item as they are reported by the States. The Sample Panel Identification dataset stores the limits for each State’s sample panel as identified by the States. The Data Item field in the Sections dataset specifies the type of record (e.g. AADT, Lane Width, etc.), with the corresponding data stored in the Value (Numeric, Text, or Date) fields. These records act independently of one another, as they indicate the properties of the attribute they portray. Furthermore, the records in both the Sections and Sample Panel Identification datasets are linked to each State’s geospatial network (i.e. LRS network) via its attribute table, which is identified as the Routes dataset that is identified in the model’s Shapes Catalog. Data associated with the lower functional systems (i.e. minor collectors in rural areas and local roads in all areas) are summarized and reported in the datasets identified in the Summaries Catalog. The level of data for these functional systems is commensurate with the Federal need for analyzing and reporting these data. The Estimates Catalog contains a dataset of pavement attributes that will be used as input to FHWA’s pavement models. The Metadata Catalog contains data that describe the methods and tools that are used for the collection and reporting of traffic, pavement, and ramp data. The References Catalog identifies the geospatial data which will ultimately be maintained by FHWA or other non-State entities. The data in these datasets are available for use by the States throughout the year for reference.
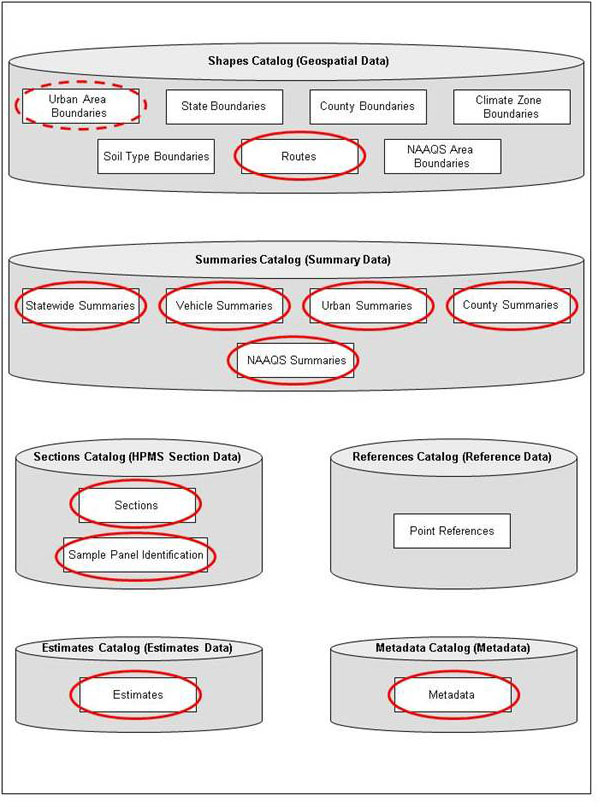
Note: Circled items in Figure 3.1 must be developed by the States and submitted to FHWA
The geospatial component of the data model provides the foundation for a national-level linear referencing system (LRS) that will serve primarily as a resource for HPMS, but will also be used to support a number of other interagency work program objectives. It will also be used to facilitate analysis and research efforts, using HPMS data.
Incorporating a geospatial component enhances the HPMS sampling process by providing an alternative methodology for sample selection and maintenance. This component allows a GIS-based process to be used to identify sections of road that have homogenous (or uniform) characteristics for key data items, which can be used for sampling purposes. More information on the GIS procedures associated with sampling is found in Chapter 6, Sampling.
The primary catalog used to identify the model’s geospatial data is the Shapes Catalog. However, the Sections Catalog identifies the attribute data that is linked to the geospatial data, which can be spatially located on the network for mapping, analysis, and reporting purposes.
Furthermore, the geospatial component of the data model involves the use of a LRS, which links the HPMS attribute data to a series of shape files. Both the geospatial and attribute data contain three referencing elements that are used to perform the linkage for linear features: (1) A unique Route ID, (2) a beginning milepoint, and (3) an ending milepoint. Point features use a route milepoint in place of a beginning and ending milepoint for referencing purposes. Data Items are identified in the Point References datasets of the model’s References Catalog and are linked to and spatially referenced in the same manner. For general guidance on the development of a State wide LRS, see the FHWA publication, All Public Roads Geospatial Representation Study.
This section describes each of the following catalogs and their associated datasets, which will be stored as tables in FHWA’s database. The datasets which are required to be developed by the States and provided to FHWA are circled in the figures for each catalog description contained in this section of the manual.
The datasets that are to be assembled by the States can either be submitted to FHWA as character separated value (CSV) files or entered manually on-screen via the HPMS software web application provided by FHWA.
The remainder of this section describes the structure of the various datasets that are to be provided by the States, as well as those that will be developed and maintained by FHWA. Tables 3.1-3.21 include the identification of constraints (indicates if the field is part of a key field, either primary (PK) or unique (UK), and is used to establish relationships within the model), field name (identifies the field of information), data type (contains the format for each data item), and description (definition of the field). Valid values for the fields are also included in the tables, where appropriate. Furthermore, the data types used in the tables are as follows:
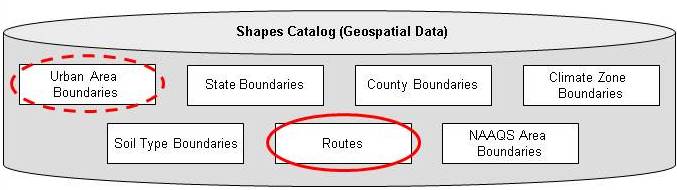
The Shapes Catalog identifies the geographic data that are used for geospatial analysis in HPMS. This catalog is comprised of seven datasets which are as follows:
The information in these datasets is derived from Federal, State and local geospatial data sources. It is preferred that the States submit their data to FHWA in an ESRI shapefile, ESRI geodatabase, or Intergraph GeoMedia Access Warehouse format. However, other formats will be accommodated provided that they are in compliance with Open Geospatial Consortium (OGC) standards: Well Known Text (WKT), Well Known Binary (WBT), and/or Geography Markup Language (GML).[i]
The Routes dataset will be stored in FHWA’s database per the following specifications:
The spatial boundaries and associated data in many of these datasets will not change from year to year, but are expected to be updated as needed to reflect any changes made over the course of the year. Furthermore, some of these datasets will be maintained by FHWA using data provided by the States and other Federal Agencies.
The States shall submit their Routes and adjusted Urban Area Boundaries (if applicable) spatial data to FHWA annually. The State Boundaries, County Boundaries, Climate Zone Boundaries, Soil Type Boundaries, Census Urban Area Boundaries, and NAAQS Area Boundaries datasets are maintained by FHWA and used for display and data management/analysis purposes.
Tables 3.1-3.7 contain information on the structure of each dataset identified in the Shapes Catalog.
The States shall include the field names, which are specified in Tables 3.5-3.8, 3.10, 3.11-3.15, 3.17, and 3.19, in the datasets that are to be submitted to FHWA.
Table 3.1 describes the polygon shapes dataset representing each of the US States. This data will be maintained by FHWA.
Constraint |
Field Name |
Data Type |
Description |
|---|---|---|---|
PK |
State Code |
Numeric(2) |
State FIPS code |
State Abbreviation |
Text |
State abbreviation |
|
State Name |
Text |
State name |
|
Shape |
Geometry |
Polygon feature |
Table 3.2 County Boundaries
Table 3.2 describes the polygon shapes dataset representing all counties for each State. This data will be maintained by FHWA.
Constraint |
Field Name |
Data Type |
Description |
|---|---|---|---|
PK |
State Code |
Numeric(2) |
State FIPS code |
PK |
County Code |
Numeric(3) |
County FIPS code |
County Name |
Text |
County name |
|
Shape |
Geometry |
Polygon feature |
Table 3.3 Climate Zone Boundaries
Table 3.3 describes the polygon shapes dataset representing the different climate zones for each State. This data will be maintained by FHWA.
Constraint |
Field Name |
Data Type |
Description |
|---|---|---|---|
PK |
Climate Zone |
Numeric(1) |
Climate zone code |
Climate Zone Name |
Text |
Climate zone description |
|
Shape |
Geometry |
Polygon feature |
Table 3.4 Soil Type Boundaries
Table 3.4 describes the polygon shapes dataset representing the AASHTO soil zones for each State. This data will be maintained by FHWA.
Constraint |
Field Name |
Data Type |
Description |
|---|---|---|---|
PK |
Soil Type |
Numeric(5) |
Soil type code |
Soil Type Name |
Text |
Soil type description |
|
Shape |
Geometry |
Polygon feature |
Table 3.5 Routes
Table 3.5 describes the State’s linear referenced network dataset. HPMS attribute data (i.e. Sections data) are linked to the network through the Route ID field in this dataset. The Route IDs, which must be unique in character, are to be defined by the States and must be in concert with the Route IDs that are contained in the Sections data. Furthermore, the submitted LRS must include, All Public Roads Including; all Federal-aid highways, with its component National Highway System (NHS) routes and NHS intermodal connectors. FHWA recommends that one ROUTE ID logically represents a highway in its entirety.
Constraint |
Field Name |
Data Type |
Description |
Valid Values |
|---|---|---|---|---|
PK |
Year_Record |
Numeric(4) |
Year for which the data apply |
The four digits of the year that the data represents. |
PK |
State_Code |
Numeric(2) |
State FIPS code |
Up to two digits for the FIPS code. See Appendix C for a complete list. |
PK |
Route_ID |
VarChar(120) |
Location reference ID for the linear feature |
Up to 120 alpha-numeric digits that identify the route. This ID must be unique within the State. |
Comments (optional) |
Text(50) |
Text descriptor for the route |
Up to 50 text characters to be used for specifying an English descriptor for the route (e.g. Interstate 70, I-70, I-70 from Exit 2 to Exit 4, etc.). |
|
Shape* |
Geometry |
Line feature |
This field is automatically generated when the State’s LRS network is developed. |
*Automatically generated when the dataset is created.
Extent – All public roads including Federal-aid highways, and ramps located within grade-separated interchanges (including NHS routes). This roadway network is termed ‘All Roads Network’ or ARNOLD.
Guidance for the development of the required ARNOLD network at the State level can be found on the Office of Highway Policy Information website: https://www.fhwa.dot.gov/policyinformation/hpms/arnold.cfm, and in the “All Public Road Geospatial Representation Study” published by the Federal Highway Administration in 2014.
Specific Requirements for Routes dataset:
Figure 3.2 is an illustration of the road network for State of Massachusetts. The red (bold) line represents the route for Interstate-90 (I-90), which is represented as a single record in the example Routes dataset excerpt (shown below Figure 3.2). It should be noted that a route can consist of a single polyline feature (i.e. one record) or multiple polyline features (i.e. multiple records).
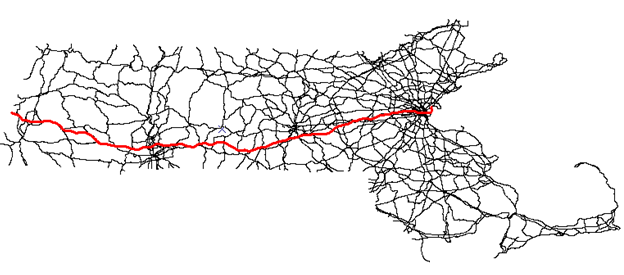
The following is an example record for this route (I-90) as it would appear in the Routes dataset:
Year_ Record |
State_Code |
Route_ID |
Shape |
|
|---|---|---|---|---|
2007 |
25 |
0000I90 |
Polyline M |
Where M indicates that there are individual measures for each line segment embedded in the record for this dataset. |
Table 3.6 Urban Area Boundaries
Table 3.6 describes the polygon shapes dataset representing either the Census urban area boundaries (UABs), or the adjusted Census UABs for each State. Each time the Census generates new urban boundaries for decennial census, the FHWA will acquire and use them for performance measure and metric evaluation, mapping and analysis purposes. At a States option, they can adjust (expand) the Census defined UABs for transportation purposes. Adjusted UABs must be approved by each States’ FHWA Division Office, prior to being included in the submitted HPMS data.
Adjusted UAB polygons are required to be included with the HPMS submission representing the calendar year data that is reported two years after the official urban areas have been released by the U.S. Census Bureau. For example, for the 2010 Census, the UABs were made available during March 2012 (i.e., two years after the decennial Census). States then had two additional years to adjust their boundaries and submit them no later than April 15, 2015 (reflecting calendar year 2014 data). At FHWA’s option, urban area information may be derived in an automated fashion based on the Census urban area polygons if a State does not report the adjusted UAB data within the aforementioned time-frame. NOTE: When adjustments are made to UABs, States must also submit updated information for Data Item 2 (Urban Code) as part of the Sections data to coincide with new boundary delineation (see Chapter 4, Sec. 4.4 for additional guidance).
Constraint |
Field Name |
Data Type |
Description |
|---|---|---|---|
PK |
Year_Record |
Numeric(4) |
Year for which the data apply |
PK |
Urban_Code |
Numeric(5) |
Census urban code |
Urban_Name |
Text |
Urban name |
|
Census_Pop |
Numeric(8) |
Decennial Census urban area population |
|
Census_Land_Area |
Numeric(4) |
Census land area (in square miles) |
|
Shape |
Geometry |
Polygon feature |
Table 3.7 NAAQS Area Boundaries
Table 3.7 describes the polygon shapes dataset representing the EPA-defined non-attainment and maintenance areas for each State. This dataset will be maintained by FHWA.
The definition of a Maintenance Area is any geographic region of the Unites States previously designated as non-attainment pursuant to the Clean Air Act (CAA) Amendments of 1990 and subsequently re-designated to attainment subject to the requirement to develop a maintenance plan under Section 175A of the CAA, as amended. The national HPMS database is used for tracking travel for air quality assurance purposes in non-attainment and maintenance areas as required by EPA under the 1990 CAA (Section 187) and the Transportation Conformity Rule, 40 CFR parts 51 and 93. More specifically, the database is used primarily for establishing regional transportation-related emissions for transportation conformity purposes. Estimated travel based on these data is used for the calibration and validation of base-year network travel models when required for non-attainment or maintenance areas.
Constraint |
Field Name |
Data Type |
Description |
|---|---|---|---|
NAAQS Area Name |
Text |
NAAQS area name |
|
PK |
Pollutant Standard |
Text |
Pollutant standard |
Shape |
Geometry |
Polygon feature |
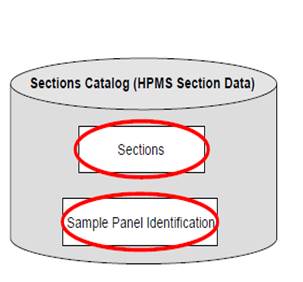
The Sections Catalog identifies the HPMS attribute data that are submitted by the States. The data identified in this catalog are geospatially linked to the Routes network file, using a unique identifier (i.e. Route ID). In general, these data are required for all Federal-aid highways and NHS routes. This requirement excludes the need to report data for any roads functionally classified as minor collector in rural areas or local in any area. Moreover, these data are optional for non-Federal-aid highways. This catalog is comprised of two datasets, Sections and Sample Panel Sections. The Sections dataset stores each State’s entire HPMS attribute dataset as they provide it to FHWA. The Sample Panel Identification dataset stores the limits for each State’s sample panel as identified by the States. The descriptions for each of the data items that are to be reported in the Sections dataset are listed in Chapter 4. The data items that are only required on a Sample Panel basis are identified as such in the individual data item descriptions (Chapter 4).
Sections data can either be imported as a file in Character Separated Value (CSV) format, or entered manually on-screen via the HPMS software web application. The data requirements for each dataset identified in this catalog are listed below.
Table 3.8 describes the State reported HPMS Section dataset representing all Federal-aid highways and other applicable sections. The specific requirements for the information to be reported in the Data Item field are defined in detail in Chapter 4. See Table 4.2 for a full list of the required HPMS Data Items and related reporting requirements.
Constraint |
Field Name |
Data Type |
Description |
Valid Values |
|---|---|---|---|---|
PK |
Year_Record |
Numeric(4) |
Year for which the data apply |
The four digits of the year the data represents. |
PK |
State_Code |
Numeric(2) |
State FIPS code |
Up to two digits for the FIPS code. See Appendix C for a complete list. |
PK |
Route_ID |
VarChar(120) |
Location reference ID for the linear feature |
Up to 120 alpha-numeric digits that identify the route. This ID must match a record in the Routes dataset. |
PK |
Begin_Point |
Decimal(8,3) |
Beginning Milepoint |
Decimal value in thousandths of a mile. |
PK |
End_Point |
Decimal(8,3) |
Ending Milepoint |
Decimal value in thousandths of a mile. |
PK |
Data_Item |
Text |
HPMS Data Items |
See Chapter 4 for detailed Data Item descriptions and valid values. Table 3.9 shows the Data Item names that can be entered in this field. |
Section_Length |
Decimal(8,3) |
Section length |
Decimal value in thousandths of a mile. This length must be consistent with the difference between End_Point and Begin_Point. |
|
Value_Numeric |
Numeric |
Numeric value for data item |
Must be numeric value as specified in the detailed Data Item descriptions (see Chapter 4). |
|
Value_Text |
VarChar(50) |
Text value for data item |
Must be text value as specified in the detailed Data Item descriptions (see Chapter 4). This field is available for State use where data is not required for a particular Data Item. This field is limited to 50 characters. |
|
Value_Date |
Date |
Date Value for data item |
Must be a date value as specified in the detailed Data Item descriptions (see Chapter 4). This field is available for State use where data is not required for a particular Data Item. |
|
Comments |
VarChar(100) |
Comment for State use |
Variable Text up to 100 characters. This field is optional. |
Extent: All Federal-aid highways and ramps located within grade separated interchanges and applicable items on other sections where a toll facility exists; optional for other sections.
Table 3.9 Sample Panel Identification
Table 3.9 describes the dataset containing the geographic limits for each States’ Sample Panel. Therefore, the States must provide FHWA with the geographic limits for their sample data for the purposes of this table. The Sample Panel Identification dataset will be used to properly identify the Sample Panel data that is contained within the Sections dataset. Each Sample Panel data item must be, at the very least, reported for the entire extent of the Sample Panel, where applicable. The data in Table 3.9 should represent only the samples resulting from the random selection process discussed in Chapter 6, Sampling. This dataset will be used in conjunction with the Sections and References datasets to create a View or Export of the sample data for use in various national models, such as the HERS (Highway Economic Requirements System) model. As this view/export is generated, each sample will have a single attribute for each data item corresponding to the Data Item field in the Sections dataset. The single attribute will be calculated based on a particular Calculation Method, as discussed in Appendix G.
Constraint |
Field Name |
Data Type |
Description |
Valid Values |
|---|---|---|---|---|
PK |
Year_Record |
Numeric(4) |
Year for which the data apply |
The four digits of the year the data represents. |
PK |
State_Code |
Numeric(2) |
State FIPS code |
Up to two digits for the FIPS code. See Appendix C for a complete list. |
PK |
Route_ID |
VarChar(120) |
Location reference ID for the linear feature |
Up to 120 alpha-numeric digits that identify the route. |
PK |
Begin_Point |
Decimal(8,3) |
Beginning Milepoint |
Enter a decimal value. |
PK |
End_Point |
Decimal(8,3) |
Ending Milepoint |
Enter a decimal value. |
Section_Length |
Decimal(8,3) |
Section length |
Enter a decimal value. This could be calculated from End MP – Beg MP. |
|
UK |
Sample_ID |
VarChar(12) |
Sample Identifier |
12-character unique ID |
Comments |
VarChar(100) |
Comment for State use |
Variable Text up to 100 characters. This field is optional. |
Extent: All Sample Panel Sections.
The Summaries Catalog identifies the datasets that store a variety of data for a defined area, such as a State or an Urban Area. The datasets that comprise this catalog are provided by the States to FHWA as a supplement to the data that is identified in the Sections Catalog. These datasets consist of summarized data for the local and rural minor collector roads, as these roads do not require section-level detail and can be generalized from State and local sources. Moreover, the datasets identified in this catalog store summary-level data for travel, highway system length, and demographics. These datasets capture travel by vehicle type, since only State estimates are required.
Summary data can either be imported as a file in Character Separated Value (CSV) format, or entered manually on-screen via the HPMS software web application. The data requirements and specifications for each dataset identified in this catalog are listed below.
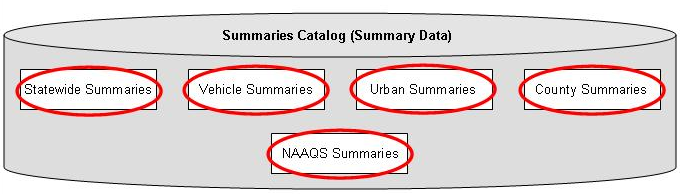
This catalog is comprised of the following five datasets:
The data requirements for each dataset are identified in the following pages.
Table 3.10 Statewide Summaries
Table 3.10 describes the dataset which contains demographic and system length estimates for all Urban and Rural public roads, functionally classified as minor collector in rural areas or local in any area, summarized by State. In addition, this dataset contains daily vehicle-miles traveled (VMT) estimates for all public roads located in Small Urban areas, functionally classified as minor collector or local. This includes NHS roads located on these functional systems.
Constraint |
Field Name |
Data Type |
Description |
Valid Values |
|---|---|---|---|---|
PK |
Year_Record |
Numeric(4) |
Calendar year for the data |
The four digits of the year the data represents. |
PK |
State_Code |
Numeric(2) |
State FIPS code |
Up to two digits for the FIPS code. See Appendix C for a complete list. |
RMC_VMT |
Numeric(8) |
Daily Travel for Rural Minor Collectors |
Report total daily vehicle-miles of travel as a whole number (round to the nearest 1,000 if preferred). |
|
RL_VMT |
Numeric(8) |
Daily Travel for Rural Locals |
Report total daily vehicle-miles of travel as a whole number (round to the nearest 1,000 if preferred). |
|
SU_VMT |
Numeric(8) |
Daily Travel for Small Urban Locals |
Report total daily vehicle-miles of travel as a whole number (round to the nearest 1,000 if preferred). |
|
Rural_Pop |
Numeric(8) |
Rural Population (> 5,000) |
Estimate/report rural population as a whole number (in thousands) |
|
Rural_Land_Area |
Numeric(8) |
Rural Land Area |
Estimate of rural land area to the nearest square mile. |
|
SU_Pop |
Numeric(8) |
Small Urban Population (5,000 to 49,000) |
Estimate/report rural population as a whole number (in thousands) |
|
SU_Land_Area |
Numeric(8) |
Small Urban Land Area |
Estimate of small urban land area to the nearest square mile. |
|
Paved_RMC_Length |
Decimal(8,3) |
Paved Rural Minor Collectors |
Report total miles of paved roads to the nearest mile. |
|
Paved_RL_Length |
Decimal(8,3) |
Paved Rural Locals |
Report total miles of paved roads to the nearest mile. |
|
Paved_UL_Length |
Decimal(8,3) |
Paved Urban Locals |
Report total miles of paved roads to the nearest mile. |
|
Unpaved_RMC_Length |
Decimal(8,3) |
Unpaved Rural Minor Collectors |
Report total miles of unpaved roads to the nearest mile. |
|
Unpaved_RL_Length |
Decimal(8,3) |
Unpaved Rural Locals |
Report total miles of unpaved roads to the nearest mile. |
|
Unpaved_UL_Length |
Decimal(8,3) |
Unpaved Urban Locals |
Report total miles of unpaved roads to the nearest mile. |
Extent: All public roads functionally classified as Rural Minor Collector/Local and Small Urban Local. Any NHS routes or toll roads on these functional systems should be included.
Metadata: See Metadata Catalog
Table 3.11 Vehicle Summaries
Table 3.11 describes the dataset which contains Travel Activity data summarized by Highway System Group and Vehicle Type.
Constraint |
Field Name |
Data Type |
Description |
Valid Values |
|
PK |
Year_Record |
Numeric(4) |
Calendar year for the data |
The four digits of the year the data represents. |
|
PK |
State_Code |
Numeric(2) |
State FIPS code |
Up to two digits for the FIPS code. See Appendix C for a complete list. |
|
PK |
FS_Group |
Numeric(3) |
Highway System Group |
Code |
Description |
100 |
Rural Interstate |
||||
200 |
Rural Other Arterial (includes Other Freeways & Expressways, Other Principal Arterials, and Minor Arterials) |
||||
300 |
Rural Other (includes Major Collectors, Minor Collectors, and Locals) |
||||
110 |
Urban Interstate |
||||
210 |
Urban Other Arterial (includes Other Freeways & Expressways, Other Principal Arterials, and Minor Arterials) |
||||
310 |
Urban Other (includes Major Collectors, Minor Collectors, and Locals) |
||||
Pct_MC |
Decimal(5,2) |
Percent of motorcycle VMT (Vehicle Class 1) |
Code percentage as 0.00 to 100.00. |
||
Pct_Cars |
Decimal(5,2) |
Percent of passenger car VMT (Vehicle Class 2) |
Code percentage as 0.00 to 100.00. |
||
Pct_Lgt_Trucks |
Decimal(5,2) |
Percent of light truck VMT (Vehicle Class 3) |
Code percentage as 0.00 to 100.00. |
||
Pct_Buses |
Decimal(5,2) |
Percent of bus VMT (Vehicle Class 4) |
Code percentage as 0.00 to 100.00. |
||
Pct_SU_Trucks |
Decimal(5,2) |
Percent of single-unit truck VMT (Vehicle Classes 5-7) |
Code percentage as 0.00 to 100.00. |
||
Pct_CU_Trucks |
Decimal(5,2) |
Percent of combination-unit truck VMT (Vehicle Classes 8-13) |
Code percentage as 0.00 to 100.00. |
||
Extent: All public roads
Metadata: See Metadata Catalog.
Reporting cycle: Review annually; update as needed.
Collection requirements: Percentages for each FS Group reported to the nearest hundredth of a percent (i.e., 45.33).
Table 3.12 Urban Area Summaries
Table 3.12 describes the dataset which contains daily travel and demographics data for all local functional system roads for each adjusted urbanized area.
Constraint |
Field Name |
Data Type |
Description |
Valid Values |
|---|---|---|---|---|
PK |
Year_Record |
Numeric(4) |
Calendar year for the data |
The four digits of the year the data represents. |
PK |
State_Code |
Numeric(2) |
State FIPS code |
Up to two digits for the FIPS code. See Appendix C for a complete list of FIPS codes. |
PK |
Urban_Code |
Numeric(5) |
Census urban code |
Up to five digits for the Census urban code. See Appendix I for a complete list eligible of codes. |
Local_VMT |
Numeric(8) |
Local (daily) travel |
Report total daily vehicle-miles of travel as a whole number (round to the nearest 1,000 if preferred). Metadata: See Metadata Catalog |
|
State_Portion_Pop |
Numeric(8) |
Population for State portion |
Estimate/report current population as a whole number (in thousands) |
|
State_Portion_Land |
Numeric(8) |
Land area for State portion |
Estimate of current land area to the nearest square mile. |
Extent: All urbanized area public roads functionally classified as Local. Any NHS routes or toll roads on these functional systems should be included.
Table 3.13 County Summaries
Table 3.13 describes the dataset which contains system length data for all roads functionally classified as minor collector in rural areas or local in any area, summarized by county.
Constraint |
Field Name |
Data Type |
Description |
Valid Values |
|
|---|---|---|---|---|---|
PK |
Year_Record |
Numeric(4) |
Calendar year for the data |
The four digits of the year the data represents. |
|
PK |
State_Code |
Numeric(2) |
State FIPS code |
Up to two digits for the FIPS code. See Appendix C for a complete list. |
|
PK |
County_Code |
Numeric(3) |
County FIPS code |
Up to three digits for the Census county code. |
|
PK |
F_System |
Numeric(1) |
Functional System |
Report only for roads functionally classified as Local (7) and Minor Collector (rural only) (6). NHS roads on these systems should be included in this summary. |
|
Code |
Description |
||||
6 |
Minor Collector (Rural only) |
||||
7 |
Local |
||||
PK |
Urban_Code |
Numeric(5) |
Urban Code |
Up to five digits for the Census urban code. See Appendix I for a complete list of valid values. Code 99999 for rural sections and 99998 for small urban sections (not within the adjusted urbanized area and with an urban population of at least 5,000). |
|
PK |
Ownership |
Numeric(2) |
Ownership Code |
Code |
Description |
1 |
State Highway Agency |
||||
2 |
County Highway Agency |
||||
3 |
Town or Township Highway Agency |
||||
4 |
City or Municipal Highway Agency |
||||
11 |
State Park, Forest, or Reservation Agency |
||||
12 |
Local Park, Forest, or Reservation Agency |
||||
21 |
Other State Agency |
||||
25 |
Other Local Agency |
||||
26 |
Private (other than Railroad) |
||||
27 |
Railroad |
||||
31 |
State Toll Authority |
||||
32 |
Local Toll Authority |
||||
40 |
Other Public Instrumentality (e.g., Airport, School, University) |
||||
50 |
Indian Tribe Nation |
||||
60 |
Other Federal Agency |
||||
62 |
Bureau of Indian Affairs |
||||
63 |
Bureau of Fish and Wildlife |
||||
64 |
U.S. Forest Service |
||||
66 |
National Park Service |
||||
67 |
Tennessee Valley Authority |
||||
68 |
Bureau of Land Management |
||||
69 |
Bureau of Reclamation |
||||
70 |
Corps of Engineers |
||||
72 |
Air Force |
||||
73 |
Navy/Marines |
||||
74 |
Army |
||||
80 |
Other |
||||
RMC_L_System_Length |
Decimal(8,3) |
Rural minor collector and local roadways length within county |
Total length to the nearest thousandth of a mile. |
||
Extent: All public roads functionally classified as Minor Collector (Rural) and Local. Any NHS routes or toll roads on these functional systems should be included.
Reporting cycle: Report annually; update as needed.
Table 3.14 NAAQS Summaries
Table 3.14 describes the dataset which contains system length and travel data for all roads functionally classified as minor collector in rural areas or local in any area summarized by EPA Non‐Attainment or Maintenance Area, and the relative pollutant standard.
Constraint |
Field Name |
Data Type |
Description |
Valid Values |
|---|---|---|---|---|
PK |
Year_Record |
Numeric(4) |
Calendar year for the data |
The four digits of the year the data represents. |
PK |
State_Code |
Numeric(2) |
State FIPS code |
Up to two digits for the FIPS code. See Appendix C for a complete list. |
PK |
Pollutant_Stnd |
Text |
Pollutant Standard |
See Appendix K for a complete list of the applicable pollutant standards. |
RMC_L_System Length |
Decimal(8,3) |
Rural minor collector and local system length |
Report total miles to the nearest mile. |
|
RMC_L_System Travel |
Numeric(8) |
Rural minor collector and local system daily travel |
Report total daily vehicle-miles of travel as a whole number (round to the nearest 1,000 if preferred). |
Extent: All public roads functionally classified as minor collector in rural areas or local in any area. Any NHS routes or toll roads on these functional systems should be included.
Reporting cycle: Review annually; update as needed.
Collection requirements: Travel and system length data for each pollutant standard within the applicable NAAQS area within the State.
The References Catalog identifies the reference data that will be maintained by FHWA or other Non-State DOT entities at some point in the future. This catalog identifies the Point References dataset, which contains data for grade‐separated interchanges that are located on the Federal‐aid system, excluding roads functionally classified as minor collector in rural areas or local in any area.
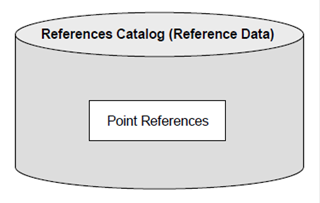
Table 3.15 describes the dataset which contains data for grade‐separated interchanges that are located on the Federal‐aid system, excluding roads functionally classified as minor collector in rural areas or local in any area. Currently, this dataset only contains the location and type of grade-separated interchanges. This dataset will be populated by FHWA for the States that do not currently have these data.
Constraint |
Field Name |
Data Type |
Description |
Valid Values |
|---|---|---|---|---|
PK |
Year_Record |
Numeric(4) |
Year for which the data apply |
The four digits of the year the data represents. |
PK |
State_Code |
Numeric(2) |
State FIPS code |
Up to two digits for the FIPS code. See Appendix C for a complete list. |
PK |
Route_ID |
VarChar(120) |
Location reference ID for the point feature |
Up to 120 alpha-numeric digits that identify the route. This ID must match a record in the Routes dataset. |
PK |
Route_Point |
Decimal(8,3) |
Route Milepoint |
Enter a decimal value that falls between the beginning and ending MPs of the Route’s section as referenced by the Route ID. |
PK |
Data_Item |
Text |
Attribute |
Future use |
Value_Numeric |
Numeric |
Numeric value for data item |
Must be numeric as specified under Data Items with their Value Numeric descriptions. |
|
Value_Text |
Varchar(50) |
Text value for data item |
Text information as specified under the Data Items with their Value Text descriptions. This field is available for State use where data is not required for a particular Data Item. This field is limited to 50 characters. |
|
Value_Date |
Date |
Date value for data item |
Date value as specified under the Data Items with their Value Date descriptions. This field is available for State use where data is not required for a particular Data Item. |
The dataset identified in this catalog stores information which describes the estimated values associated with the various pavement-related data items reported in the Sections dataset. The data identified in this catalog are used only for national-level analysis and are not used for reporting purposes. The data contained in the Estimates dataset represents the State’s best estimate of current conditions or construction practices where measured data are not available for reporting purposes.
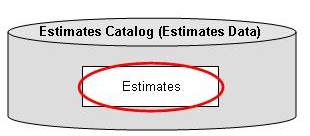
Table 3.16 Estimates
Table 3.16 describes the dataset which contains statewide estimates to be used as default inputs for FHWA’s pavement deterioration models. Table 3.18 contains a list of the valid entries for the Estimate Type Field and their associated values.
Constraint |
Field Name |
Data Type |
Description |
Valid Values |
|
|---|---|---|---|---|---|
PK |
Year_Record |
Numeric(4) |
Calendar year for the data |
The four digits of the year the data represents. |
|
PK |
State_Code |
Numeric(2) |
State FIPS code |
Up to two digits for the FIPS code. See Appendix C for a complete list. |
|
PK |
Estimate_Type* |
Text |
Estimates Type |
A detailed list of the estimate types is provided in Table 3.18 below. |
|
PK |
F_System |
Numeric(1) |
Functional System |
Code |
Description |
1 |
Interstate |
||||
2 |
Principal Arterial – Other Freeways and Expressways |
||||
3 |
Principal Arterial – Other |
||||
4 |
Minor Arterial |
||||
5 |
Major Collector |
||||
6 |
Minor Collector |
||||
7 |
Local |
||||
PK |
Is_Urban |
Text |
Rural or Urban |
Code |
Description |
Y |
Urban (Population of at least 5,000) |
||||
N |
Rural |
||||
PK |
Is_State_Owned** |
Text |
On State/Off State System |
Code |
Description |
Y |
On-State System |
||||
N |
Off-State System |
||||
Value_Numeric |
Decimal(5,1) |
Numeric Value |
Must be numeric as specified (in Table 3.18) under the Value Numeric descriptions. |
||
Extent: All Federal-aid highways
*Determine and code the predominant Estimate Type value when multiple Estimates Types apply.
**This field is intended to communicate to FHWA what each State considers to be their off-state system vs. on-state system.
Table 3.17 Estimate Types and Valid Values.
Type |
Description |
Value Numeric |
||
|---|---|---|---|---|
Last_Overlay_Thickness |
Typical design or construction last overlay thickness. |
Last overlay thickness to the nearest 0.5 inch. |
||
Thickness_Rigid |
Typical design or construction thickness of rigid pavement. |
Rigid pavement thickness to the nearest 0.5 inch. |
||
Thickness_Flexible |
Typical design or construction thickness of all AC (asphalt concrete) pavement layers. |
Flexible pavement thickness to the nearest 0.5 inch. |
||
Base_Type |
Base Type |
Code |
Description |
|
1 |
No base |
|||
2 |
Aggregate |
|||
3 |
Asphalt or cement stabilized |
|||
5 |
Hot mix AC (Bituminous) |
|||
6 |
Lean concrete |
|||
7 |
Stabilized open-graded permeable |
|||
8 |
Fractured PCC |
|||
Base_Thickness |
Typical design or construction thickness |
Base thickness to the nearest whole inch. |
||
Binder_Type |
Binder Type |
See following table below. |
||
Dowel_Bar |
Presence of Dowel Bars |
Code |
Description |
|
1 |
No – Dowel Bars not typically used |
|||
2 |
Yes – Dowel Bars are typically used |
|||
Joint_Spacing |
Typical joint spacing |
Joint spacing to the nearest whole foot. |
||
1 |
Less than AC–2.5 |
|---|---|
2 |
AC–2.5 to AC–4 |
3 |
AC–5 to AC–9 |
4 |
AC–10 to AC–19 |
5 |
AC–20 to AC–29 |
6 |
AC–30 to AC–39 |
7 |
AC–40 to AC–49 |
8 |
AC–50 or more |
Low Temperature Grade |
||||||||||
|---|---|---|---|---|---|---|---|---|---|---|
Less than –4 |
–4 to –9 |
–10 to –15 |
–16 to –21 |
–22 to –27 |
–28 to –33 |
–34 to –39 |
–40 to –45 |
–46 or more |
||
High Temperature Grade |
Less than 40 |
10 |
20 |
30 |
40 |
50 |
60 |
70 |
80 |
90 |
40 to 45 |
11 |
21 |
31 |
41 |
51 |
61 |
71 |
81 |
91 |
|
46 to 51 |
12 |
22 |
32 |
42 |
52 |
62 |
72 |
82 |
92 |
|
52 to 57 |
13 |
23 |
33 |
43 |
53 |
63 |
73 |
83 |
93 |
|
58 to 63 |
14 |
24 |
34 |
44 |
54 |
64 |
74 |
84 |
94 |
|
63 to 69 |
15 |
25 |
35 |
45 |
55 |
65 |
75 |
85 |
95 |
|
70 to 75 |
16 |
26 |
36 |
46 |
56 |
66 |
76 |
86 |
96 |
|
76 to 81 |
17 |
27 |
37 |
47 |
57 |
67 |
77 |
87 |
97 |
|
82 to 87 |
18 |
28 |
38 |
48 |
58 |
68 |
78 |
88 |
98 |
|
88 or more |
19 |
29 |
39 |
49 |
59 |
69 |
79 |
89 |
99 |
|
This catalog consists of metadata, which is data that describes the other datasets and data items in the State’s HPMS dataset. Metadata within HPMS are used to describe data collection procedures and post-processing that may impact the consistency or quality of the data. Metadata applies to an entire data item or group of data items, and not any single data item entry. Some Metadata may be published annually in the Highway Statistics publication and may be provided to data users as requested. FHWA will not use Metadata to modify or alter a State’s HPMS data submittal.
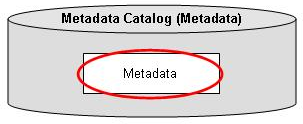
Table 3.18 Metadata
Table 3.18 describes the dataset which contains data that captures and explains variability in the collection and reporting of traffic and pavement data in HPMS. Table 3.20 lists the valid entries for the Metadata Type Field and their associated values.
Constraint |
Field Name |
Data Type |
Description |
Valid Values |
|
|---|---|---|---|---|---|
PK |
Year_Record |
Numeric(4) |
Calendar year for the data |
The four digits of the year the data represents. |
|
PK |
State_Code |
Numeric(2) |
State FIPS code |
Up to two digits for the FIPS code. See Appendix C for a complete list. |
|
PK |
Metadata_Type* |
Text |
Metadata Type |
A detailed list of the metadata types is provided in Table 3.20 below. Multiple metadata types are permitted per data item. |
|
PK |
F_System |
Numeric(1) |
Functional System |
Code |
Description |
1 |
Interstate |
||||
2 |
Principal Arterial - Other Freeways and Expressways |
||||
3 |
Principal Arterial - Other |
||||
4 |
Minor Arterial |
||||
5 |
Major Collector |
||||
6 |
Minor Collector |
||||
7 |
Local |
||||
PK |
Is_Urban |
Text |
Rural or Urban |
Code |
Description |
Y |
Urban (population of at least 5,000) |
||||
N |
Rural |
||||
PK |
Is_State_Owned** |
Text |
On State/Off State System |
Code |
Description |
Y |
On-State System |
||||
N |
Off-State System |
||||
Value_Numeric |
Numeric(5) |
Numeric Value |
Must be numeric as specified (in Table 3.20) under the Value Numeric descriptions. |
||
Extent: All Federal-aid highways; optional for other sections.
*Determine and code the predominant Metadata Type value when multiple Metadata Types apply.
**This field is intended to communicate to FHWA what each State considers to be their off-state system vs. on-state system.
Table 3.19 Metadata Types and Valid Values.
Type |
Description |
Value Numeric |
|
|---|---|---|---|
AADT_Pct_Actual |
Percent total section-level AADTs reported that are based on actual counts for the reported data year |
Enter value to the nearest whole percent. |
|
AADT_24 |
Number of permanent and portable counter locations that were counted for a duration of 24 hours or more |
Integer |
|
AADT_48 |
Number of permanent and portable counter locations that were counted for a duration of 48 hours or more |
Integer |
|
AADT_Season |
AADT Seasonal Adjustment |
Code |
Description |
1 |
AADT is not seasonally adjusted |
||
2 |
AADT is seasonally adjusted |
||
3 |
AADT is from counts taken throughout the year |
||
AADT_Week |
AADT Day-of-Week Adjustment |
Code |
Description |
1 |
AADT is not adjusted for day-of-week |
||
2 |
AADT is adjusted for day-of-week |
||
3 |
AADT is from counts taken throughout the week |
||
AADT_Axle |
AADT Axle Adjustment |
Code |
Description |
1 |
AADT is not adjusted for number of axles |
||
2 |
AADT is adjusted for number of axles |
||
3 |
AADT is from vehicle count data |
||
AADT_Growth |
AADT Growth Adjustment |
Code |
Description |
1 |
AADT is not adjusted for annual growth/change |
||
2 |
AADT is adjusted for annual growth/change |
||
3 |
AADT is from current year (i.e., data year) counts |
||
Class_Pct_Actual |
Percent of class AADTs (i.e., Single-unit Truck & Bus, and Combination Truck AADT) reported that are based on actual counts for the reported data year |
Enter value to the nearest whole percent. |
|
Class_24 |
Number of permanent and portable classification count locations that were counted for a duration of 24 hours or more |
Integer |
|
Class_48 |
The number of permanent and portable classification count locations that were counted for a duration of 48 hours or more |
Integer |
|
Class_Season |
Class Seasonal Adjustment |
Code |
Description |
1 |
No adjustment |
||
2 |
With adjustment |
||
Class_Week |
Class Weekly Adjustment |
Code |
Description |
1 |
No adjustment |
||
2 |
With adjustment |
||
Class_Growth |
Class Growth Adjustment |
Code |
Description |
1 |
No adjustment |
||
2 |
With adjustment |
||
Travel_Source |
Source of Travel Data |
Code |
Description |
1 |
State traffic database only |
||
2 |
State traffic database and local governments (MPO, Cities, and Counties) |
||
3 |
Other |
||
Travel_Volume_Type |
Type of volume counts used for reporting purposes |
Code |
Description |
1 |
Short-term counts only (>= 24 hrs in duration) |
||
2 |
Continuous permanent class counts only |
||
3 |
Both short term and continuous counts |
||
Travel_Class_Type |
Type of classification counts used for reporting purposes |
Code |
Description |
1 |
Short-term counts only (>= 24 hrs in duration) |
||
2 |
Continuous permanent class counts only |
||
3 |
Both short term and continuous counts |
||
Travel_QA |
Quality assurance program exists for any traffic data |
Code |
Description |
1 |
No existing traffic data quality assurance program |
||
2 |
State traffic data only |
||
3 |
State and Local traffic data |
||
4 |
Local traffic data only |
||
IRI_Equip_Type |
Type of equipment used predominately for measuring the International Roughness Index (IRI) |
Code |
Description |
1 |
3-dimensional (3-D) imaging system/scanning laser |
||
2 |
Laser |
||
3 |
Other |
||
IRI_Report_Interval |
Longitudinal distance between the outputs of a profile index (IRI) value. (Ref: AASHTO Designation: M328-14; 3.1.15) |
Report interval to the nearest foot. |
|
IRI_Sample_Interval |
Longitudinal distance between data capture points. These data points are combined to create one profile data point. These points, in turn, may be combined to create a final value in the reported profile. (Ref: AASHTO Designation M328-14; 3.1.18) |
Report interval to the nearest 0.1 inch. |
|
Rutting_Method |
Method (Manual or Automated) used to collect most of the rutting data. |
Code |
Description |
1 |
Manual |
||
2 |
Automatic |
||
Rutting_Equip_Type |
Type of equipment used predominately for collection of rutting data. |
Code |
Description |
1 |
3-dimensional (3-D) imaging system/scanning laser |
||
2 |
Laser |
||
3 |
Other/Manual |
||
Rutting_Num_Sensors |
Number of sensors for the equipment used predominately for collection of rutting data |
Code |
Description |
1 |
Three (3) sensors |
||
2 |
Five (5) sensors |
||
3 |
Greater than five (>5) sensors |
||
4 |
3-dimensional (3-D) imaging system/scanning laser |
||
5 |
Other |
||
Rutting_Interval |
For manual rutting method: sampling interval. (Ref: AASHTO Designation R48-10(2013); 7.1.6) or For automatic rutting method: report interval—the travel distance between the reported data. (Ref: AASHTO Designation PP70-14 (2016); 4.2) |
Report interval to the nearest foot. |
|
Rutt_Trans_Prof_Interval |
Transverse profile data point separation distance. (Ref: AASHTO Designation PP70-14 (2016); 5.1) |
Report interval to the nearest 0.1 inch. |
|
Faulting_Interval |
Sampling interval. (Ref: AASHTO Designation R36-13; 5.2.5) |
Report interval to the nearest 0.1 inch. |
|
Faulting_Method |
Method (Manual or Automated) used to collect most of the faulting data. |
Code |
Description |
1 |
Manual |
||
2 |
Automatic |
||
Faulting_Equipment_Type |
Type of equipment used predominately for measuring the faulting data |
Code |
Description |
1 |
Manual |
||
2 |
Laser |
||
3 |
3-dimensional (3-D) imaging system/scanning laser |
||
Other |
|||
Cracking_Pct_Equip |
Type of equipment used predominately for measuring the percent of cracking (Cracking_Percent). |
Code |
Description |
1 |
Windshield survey |
||
2 |
Visual distress survey (side of road) |
||
3 |
Manually identify cracking from video |
||
4 |
Automated crack identification to detect cracking from video |
||
5 |
Combined manual and automatic crack identification from video |
||
6 |
3-dimensional (3-D) imaging system |
||
7 |
Other |
||
Cracking_Method |
Protocol used to identify pavement distresses |
Code |
Description |
1 |
Long-Term Pavement Performance (LTPP) |
||
2 |
American Association of State Highway and Transportation Officials (AASHTO) |
||
3 |
Modified LTPP |
||
4 |
Modified AASHTO |
||
5 |
State developed protocol |
||
6 |
Other |
||
Pave_Rep_Method |
Reporting method for pavement distresses and related data items (e.g., IRI, PSR, Surface Type, etc.) associated with divided Interstate roadway sections |
Code |
Description |
1 |
Inventory direction (only) |
||
2 |
Inventory & Non-inventory direction |
||
Ramp_Termini_Desc |
Ramp Termini |
Code |
Description |
1 |
Gore to Gore |
||
2 |
Taper to Taper |
||
3 |
Other |
||
Ramp_Traf_Est_Method |
Ramp Traffic Estimation Method |
Code |
Description |
1 |
Manual counts |
||
2 |
Portable counts |
||
3 |
Permanent count equipment |
||
4 |
ITS equipment |
||
5 |
Ramp metering equipment |
||
6 |
Ramp balancing |
||
7 |
Turning or ramp movement estimation software |
||
8 |
Estimation based on fixed percent of mainline volumes |
||
9 |
Other estimation method not described above |
||
1 Environmental Systems Research Institute, Inc. (ESRI), Shapefile Technical Description: an ESRI White Paper, July 1998

