Previous Chapter « Table of Contents » Next Chapter
Several different design methodologies were identified in Chapter 2 that have been used to design rockeries. Prescriptive design methods based on assumed rock dimensions are appropriate for rockeries less than 1.8 m (8 ft) high in cut conditions. (2,3) Analytical or closed- form solution methods, such as those suggested by Gray & Sotir, (4) Hendron,(5) Hemphill (unpublished), and SAGE (unpublished), have been used for rockeries that exceed 1.8 m (8 ft) or rockeries constructed in fill conditions.
Because each method makes various assumptions regarding parameters such as soil strength, backfill geometry, and rockery face inclination, it generates different rockery design geometries for the same input data. To evaluate the differences between each method and determine the methods most appropriate for use as a design standard for retaining rockeries, four example design cases were developed and considered. The cases represent a typical range of soil conditions, backslope geometry, and back cut geometry that might be encountered for a typical retaining situation, including:
For each case, the rockeries were analyzed for heights of 1.2, 2.1, and 3.0 m (4, 7, and 10 ft). Surcharges were not considered because most of the design procedures being reviewed are unable to incorporate surcharge pressures. The soil and rockery design properties used for each case are summarized in Table 5 and represented graphically on Figures 23 and 24. For the purposes of comparing and contrasting the results from the various analysis procedures, impacts due to other factors, including frost heave or scour, were neglected.
| Design Property | Case #1 | Case #2 | Case #3 | Case #4 |
|---|---|---|---|---|
| Soil Friction Angle, φ
(assumed) |
30 | 36 | 34 | 30 / 40(a) |
| Retained Ground Surface Inclination ("Backslope"), β
(assumed) |
Level | Level | 1V:2H | Level |
| Allowable Sliding Friction Factor, μ (b) FS=1.5 | 0.30 | 0.35 | 0.35 | 0.30 |
| Allowable Passive Resistance at Toe (EFP), kN/m3
(pcf) |
37.3
(230) |
49.0
(300) |
44.1
(275) |
37.3
(230) |
| Face Batter (V:H) (assumed) |
4:1 (14°) |
4:1 (14°) |
4:1 (14°) |
4:1 (14°) |
| Back Cut Inclination (V:H) (assumed) |
8:1 (7.1°) |
8:1 (7.1°) |
8:1 (7.1°) |
2:1 (26.5) |
| Retained Soil Density
γs, kN/m3 (pcf) |
18.6
(120) |
18.6
(120) |
18.6
(120) |
18.6
(120) |
| Rockery Facing Density
γR, kN/m3 (pcf) |
23.5
(150) |
23.5
(150) |
23.5
(150) |
23.5
(150) |
Notes:
EFP = Equivalent Fluid Pressure
(a) For Case #4, a relatively conservative value of 40º was selected for the friction angle (φ) of the crushed rock backfill, even though the actual value would likely be higher.
(b) Passive resistance at the toe was computed using a Rankine pressure coefficient (KP) equal to
tan2(45+φ/2). Reduced from ultimate to allowable value using a factor of safety of 1.5.
(c) Frictional resistance (μ) was computed using an average of tanf and tan(2/3φ). Reduced from ultimate to allowable value using a factor of safety of 1.5.
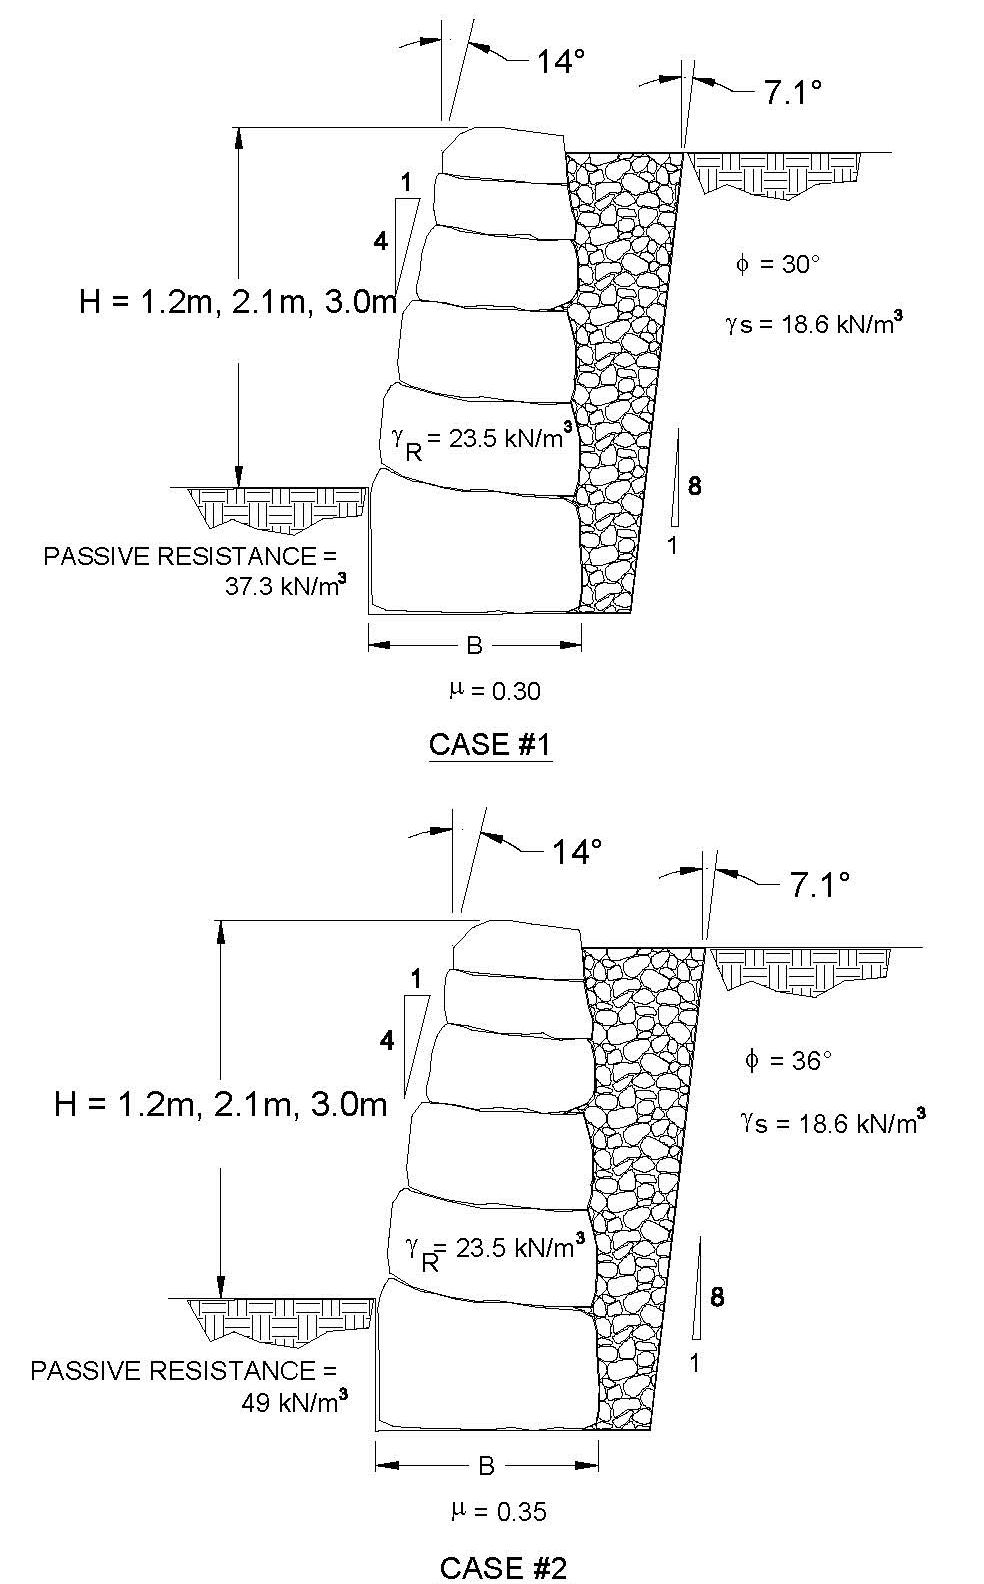
Figure 23. Graphic. Design geometry for example design Cases #1 and #2.
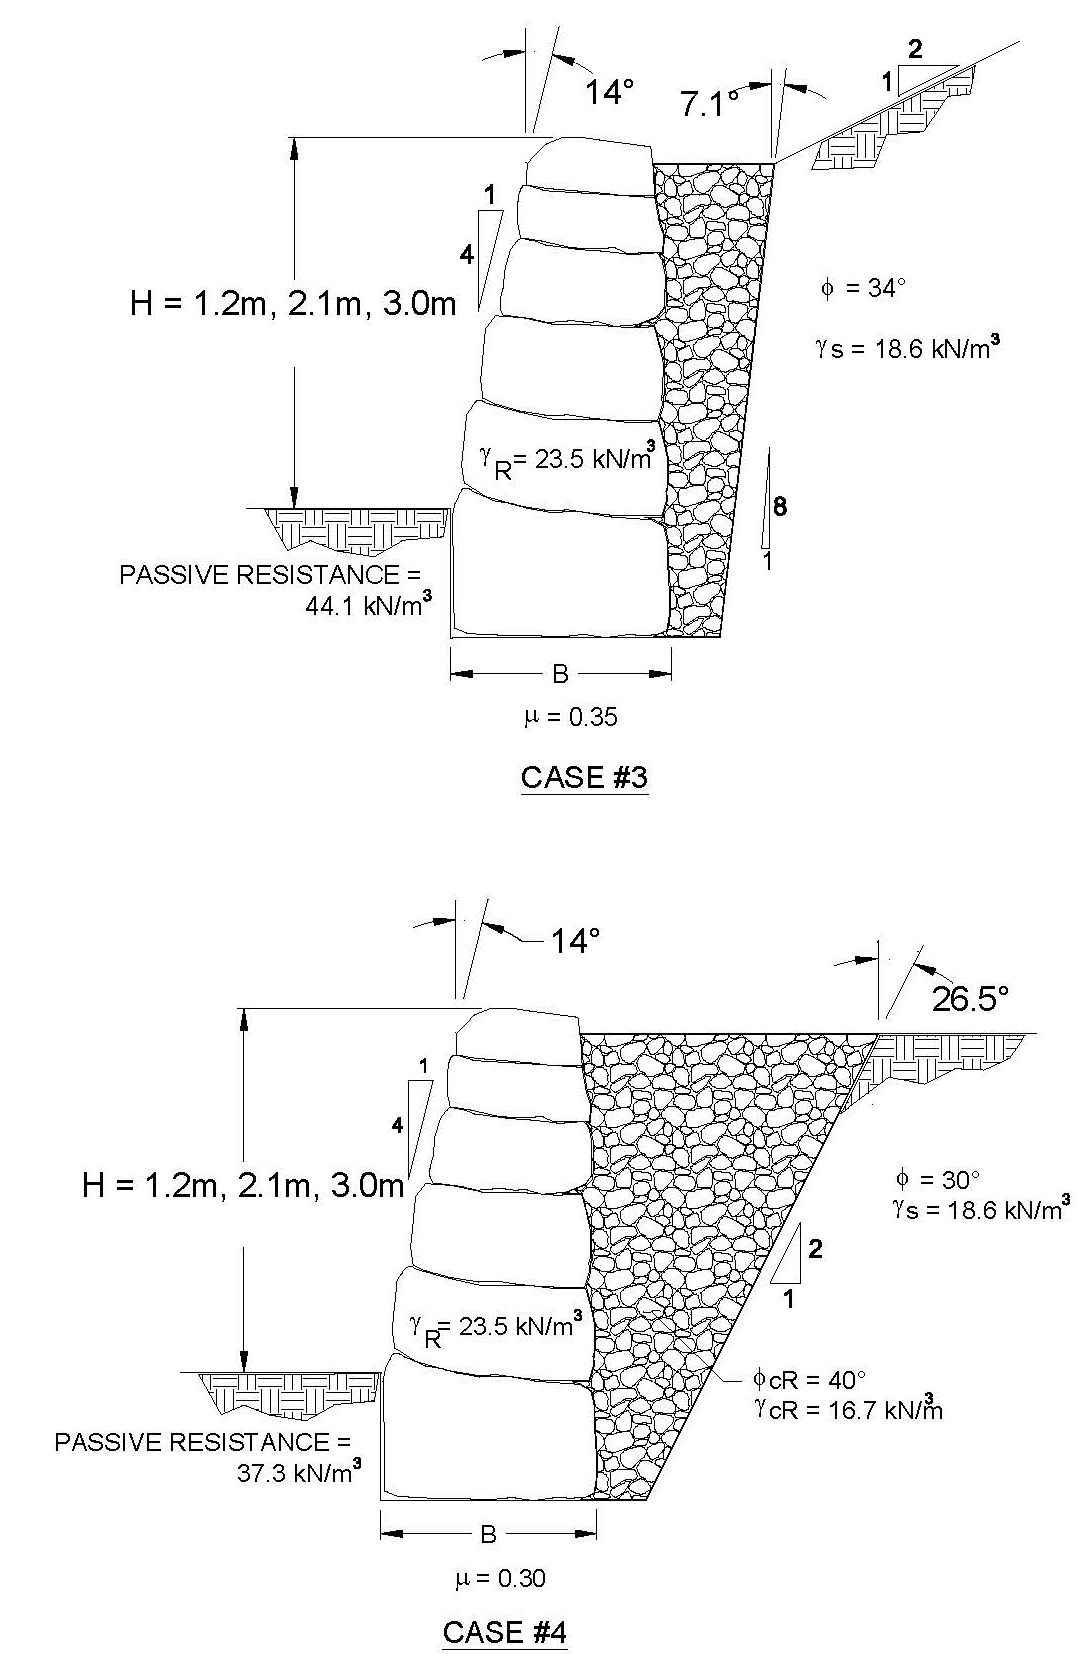
Figure 24. Graphic. Design geometry for example design Cases #3 and #4.
View larger version of Figure 24.
The required minimum rockery base rock width was determined for each of the typical cases listed above using the methodologies by Gray & Sotir (4), Hendron(5) , Hemphill, and SAGE. Case #3 could not be checked using the Hendron equations because the equations were developed for level backfill conditions only.
In general, all four methods are based on the assumption that the retained soil exerts a lateral earth pressure on the back of the rockery and that the rockery must resist this pressure though rock interaction, rockery weight, and rockery size. In that respect, the methods are similar and, as a result, the computed base widths are similar.
With the exception of the Hendron charts, the methods reviewed all incorporated the concept of a factor of safety into the analysis. The analysis method currently used by SAGE typically uses a minimum overturning factor of safety (FSOT) of 2.0 for checking external and internal (inter- rock) overturning. However, the analysis is often controlled by external sliding, for which a minimum factor of safety (FSSL) of 1.5 is used. This is in contrast to statements made by other authors that overturning controls rockery design and sizing.
For the Hemphill method, a factor of safety of 2.0 was also used for both FSOT and FSSL. This value is based on guidance in the Hemphill report regarding rockeries constructed with intermittent observation by the designer. Because rockery construction is typically not observed on a full-time basis, we believe this is an appropriate assumption for design consistent with this method.
A design factor of safety is not proposed by Gray & Sotir (4) for use with their procedure. Because this method is based solely on overturning stability, a value of FSOT of 2.0 was selected for the evaluation, which is consistent with the other methods evaluated.
Unlike the other three methods, the Hendron equation was developed to determine critical H/B ratios. It is implied in the Gifford and Kirkland paper(5) that the equations were derived for a factor of safety of 1.0, although it is never explicitly stated. As a result, although the computed base rock widths appear similar to other methods, wider base rocks would actually be required to achieve equivalent factors of safety.
For the Gray & Sotir, Hendron, and SAGE methods, the rockery thickness is assumed to be either uniform or to taper from bottom to top with a relatively shallow inclination (4V:1H to 6V:1H). Therefore, the computed mass used to resist overturning is similar for each procedure, and these methods result in similar base rock widths when computing FSOT.
However, the Hemphill method checks for overturning in a step-wise fashion from the top down. As a result, upper rocks tend to be much smaller than lower rocks, which results in a less uniform, and more stepwise, rockery thickness. Furthermore, because the size and weight of the uppermost facing rocks is minimized early in the design procedure, there is less normal force (weight) with which to generate frictional resistance, and, as a result, the design procedure tends to result in wider base rocks that the other methods. In addition, the base rocks computed using the Hemphill method tend to be more deeply embedded than the other methods in which foundation depth is generally prescribed.
The computed base rock widths for each method and design case are presented in Table 6. The calculations generally yielded base widths that are less than the minimum prescriptive values recommended in each reference. Therefore, if these methods were used for design, the prescriptive base rocks widths would control the design.
While performing the analyses for each of the different methods, insights were gained regarding specific methods and results. These insights are described in the following subsections.
As discussed in Chapter 2, the equations presented in the Gray & Sotir (4) textbook for design of "rock breast walls" appear to contain an error. The corrected equations, which have been confirmed with the authors, are summarized below in Figures 25, 26, 27, and 28. For the computation of the coefficient of active earth pressure (KA), the value of δ should be assumed to be equal to φ.
| Computed Base Width "B" (meters) (a) | ||||||
|---|---|---|---|---|---|---|
| Design Cases | Methodology | |||||
| Prescriptive B=0.3H - 0.5H | SAGE FSOT ³ 2 FSSL ³ 1.5 | Hemphill FSOT ³ 2 FSSL ³ 2 | Gray & Sotir FSOT ³ 2 | Hendron (b) FSOT = 1 | ||
| Case #1 | 1.2 m | 0.4-0.6 | 0.3 | 1.4 | 0.3 | 0.4 |
| 2.1 m | 0.6-1.1 | 1.0 | 2.3 | 0.5 | 0.7 | |
| 3.0 m | 0.9-1.5 | 1.4 | 3.2 | 0.7 | 1.0 | |
| Case #2 | 1.2 m | 0.4-0.6 | 0.5 | 0.8 | 0.2 | 0.3 |
| 2.1 m | 0.6-1.1 | 0.8 | 1.6 | 0.4 | 0.5 | |
| 3.0 m | 0.9-1.5 | 1.0 | 2.1 | 0.5 | 0.7 | |
| Case #3 | 1.2 m | 0.4-0.6 | 0.6 | 1.6 | 0.3 | N/A (c) |
| 2.1 m | 0.6-1.1 | 1.1 | 3.0 | 0.5 | N/A (c) | |
| 3.0 m | 0.9-1.5 | 1.5 | 4.1 | 0.8 | N/A (c) | |
| Case #4 | 1.2 m | 0.4-0.6 | (0.4) (d) | 0.5 (1.2) (d) | 0.1 (0.2) (d) | 0.1 (1.0) (d) |
| 2.1 m | 0.6-1.1 | (0.8) (d) | 1.3 (2.0) (d) | 0.2 (0.35) (d) | 0.1 (1.7) (d) | |
| 3.0 m | 0.9-1.5 | (1.1) (d) | 1.8 (2.8) (d) | 0.3 (0.5) (d) | 0.2 (2.4) (d) | |
Notes:
(a) Only computed values are shown. In most cases, a prescriptive, minimum value such as 0.5H or 0.3H would be used for design.
(b) The Hendron equations are for the critical H/B ratio with a presumed factor of safety of 1.0. The method does not provide for inclusion of a specified factor of safety.
(c) Method derived for level backfill conditions only; not applicable to sloping backfill.
(d) Values in (parentheses) recalculated assuming the soil failure plane lies entirely within the
crushed rock backfill zone. Based on γcrushed rock = 16.7 kN/m3, φ=40°, and a vertical face to the back of the facing rocks.
The revised equations were used to check a chart solution presented in the Gray & Sotir text. The results closely match the sample chart provided in Gray & Sotir for level backfill conditions. However, the charted values are about 5% to 10% lower than the original Gray & Sotir chart for backslope inclinations (β) between 15º and 20º degrees. We believe this difference is related to the method in which the KA value is computed for sloping backfill conditions. The method used to calculation KA was not discussed in the Gray & Sotir text.
Of note is the fact that the equation for well-constructed rockeries (WCRs) developed by Hendron, which is shown in Figure 9, is identical to the Gray & Sotir equations as revised by the authors. Some factors have been presented differently in the two equations; for example, Gray & Sotir have substituted the term "b" (see Figure 27) into the equation, whereas Hendron wrote out all the terms.
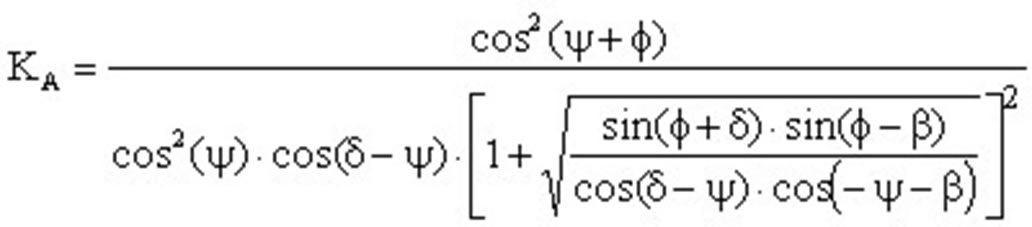
Figure 25. Equation. Computation of active earth pressure coefficient (KA) by the Coulomb method.
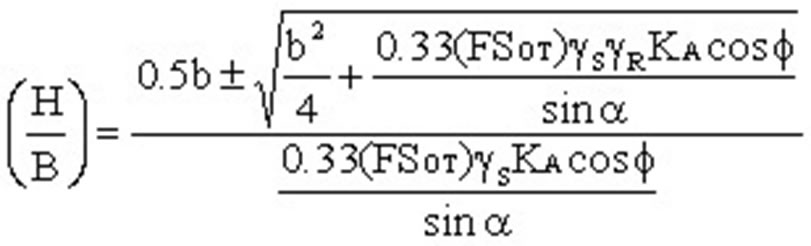
Figure 26. Equation. Corrected equation for height-to-base-width (H/B) ratio for use with Gray & Sotir analysis method.
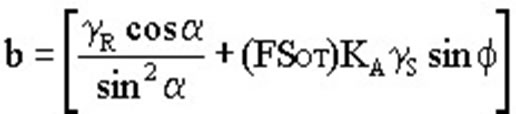
Figure 27. Equation. Corrected definition of the term "b" in Figure 18.
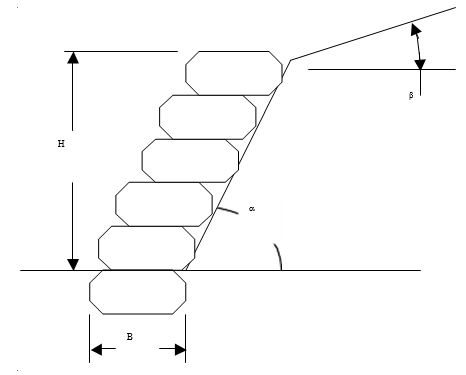
Figure 28. Graphic. Assumed geometric relationships to be used for equations shown in Figures 25, 26, and 27.
Table 6 also indicates that base rock widths computed using the Gray & Sotir method (FSOT = 2.0) are actually smaller (less conservative) that those computed using the Hendron method (FSOT = 1.0). Normally, one would assume the smaller rock widths would be computed using the method with the lower factor of safety. However, Gifford and Kirkland(5) recommended the Hendron PCR design curves be used for design in lieu of the WCR curves (see Chapter 2 and Figure 9), and as a result, the Hendron method is more conservative than the Gray & Sotir method.
As discussed previously, the target factor of safety for both FSSL and FSOT in the Hemphill analyses is recommended to be between 1.5 and 2.5. Hemphill recommends lower factors of safety be used as the amount of control and observation the design engineer has during construction increases. A factor of safety of 2.0 was used in the analyses performed for this study, which is consistent with Hemphill's recommendations for intermittent construction observation. This factor of safety is applied to both internal (inter-rock) sliding and overturning above the ground line and external sliding below the ground line.
As discussed previously, the Hemphill method tends to minimize the size and weight of the rocks at the top of the rockery, which reduces the overall structure weight over the exposed face of the rockery. The net impact is that there is less weight to provide a normal force to resist sliding along the bottom of the base rock. Furthermore, the value of FSSL used is higher than other analysis methods, and more resisting force is required to resist sliding while obtaining the desired factor of safety. As Table 6 demonstrates, the combined impact of these factors results in base rock sizes that are larger than the other three methods. While the use of a higher factor of safety (FSSL) with this method leads to somewhat of an "apples-to-oranges" comparison to the other methods, the value of FSSL was selected based on the criteria provided in the Hemphill report. This type of comparison has value because it is important to understand the differences in design that can be expected based on the method-specific recommendations.
In addition, the required embedment computed for 1.2- to 3.0-m-tall (4- to 10-ft-tall) rockeries is 1.0 to 1.7 m (3.3 to 6.0 ft), which is about 60 percent to 80 percent of the exposed rockery height.
For the other three methods used, the embedment is generally a prescribed depth based on the conditions at the toe of the rockery and varies between 0.3 and 0.6 m (1 and 2 ft).
The equations developed by Hendron and Gray & Sotir account for the inclination of the back cut slope by assuming the rockery is constructed with facing rocks directly against the stable soil slope. In this respect, the methods assume the rockery is constructed as a protecting rockery rather than a retaining rockery. Consequently, the minimum values of β developed for Case #4 are relatively small. Because the Hemphill method also accounts for this through the selection of KA, which decreases as the back cut angle (ψ) increases, smaller base rock widths are computed for Case #4 than for the other three cases. The SAGE equations have been derived in such a way that they are not applicable without extensive modification to the evaluation of a sloping soil condition with α less than 70º. As a result, base rock widths are only provided for the crushed rock backfill condition, and were not computed for the shallow slope condition.
Many modern rockeries are constructed by filling the space between the facing rocks and native soil with crushed rock, as shown in Figures 23 and 24. As Figure 24 demonstrates, the constructed rockery system may not match the geometric assumptions used by Hendron or Gray & Sotir for an inclined back cut because although the soil slope is relatively flat, the rockery face is still relatively steep. Therefore, for the Hemphill, Hendron, and Gray & Sotir methods, the minimum base widths required were checked to determine if the shallow retained soil or retained crushed rock was the controlling backfill condition.
For this evaluation, a conservative φ value of 40º was used for the crushed rock backfill. Although the actual value of φ is likely to be significantly higher for the crushed rock, we selected a conservative value that would provide a "worst case" value if poor quality rock were used.
Review of Table 6 indicates that for the Gray & Sotir method, the values of B increase to values that are similar to Cases #1 and #2, which have a similar geometries but lower φ values. Similar results were found using the Hemphill method.
Evaluating the crushed rock backfill using the Hendron method, however, resulted in computed base widths that were larger than previously computed for Case #1. Review of the equation for this method indicates the base widths increase relatively quickly as the assumed back cut (in this case, the back of the rockery) nears vertical. The full derivation of the Hendron equations is not presented in Gifford and Kirkland, so it is difficult to ascertain why this occurs. However, it appears that because the equations were originally derived for protecting rockeries, assumptions were made that lead to conservative rockery designs for retaining applications.
Relatively speaking, the Gray & Sotir and Hendron methods produced the narrowest overall base widths as compared to the other methods, except for Case #4. For Case #4, the base widths computed for the gravel backfill by Hendron's method were larger than those for the SAGE and Gray& Sotir methods, and comparable to the Hemphill method, as discussed previously. When only the shallow soil slope was considered for Case #4, the Hendron and Gray & Sotir procedures produced very narrow base rock widths that are more consistent with a protecting rockery.
The Hemphill method produced the largest base widths because it tends to optimize (minimize) the rock sizes at the top of the rockery at the expense of the base. It is likely the results could be made to more closely match the other methods if the upper rocks are sized artificially large for the analysis method; that is, if overly large factors of safety were used at the top of the rockery. However, this is impractical for design because the base dimension would need to be known in advance. The SAGE method produced values that were near the average for the other methods.
The calculated base widths (B) presented in Table 6 represent the nominal values computed from each method. However, the minimum prescriptive values for β are between 0.3H and 0.5H, and would likely be used for design even if the analysis indicated a smaller base rock could be used. Furthermore, for the Hendron method, the ratios presented in Table 6 include a FSOT of only 1.0. Because this represents incipient failure, larger base widths would be required for design regardless.
Based on the evaluation performed for this report, it can be concluded that each method provides valuable tools for rockery evaluation or design. The methods proposed by Gray & Sotir, Hendron, and Hemphill, although difficult to adapt to a rigorous design methodology, can all be easily adapted for evaluation of the stability of existing rockeries. Although the Hemphill method seems to result in the most conservative rockery designs, it has the advantage that it can be adapted to seismic design because the loads are computed within the analysis. The Hendron and Gray & Sotir methods address static loads only.
At a minimum, these methods provide valid screening methods that can be used to determine if further analysis is warranted. Charts developed from the Gray & Sotir and Hendron analyses, in particular, can be used for rapid evaluation of a particular combination of soil conditions and slope geometry. As example chart developed using the Gray & Sotir method is presented as Figure 29.
For the recommended design methodology to be useful, however, it must be adaptive to multiple design variables, including rockery size and height, backslope conditions, soil conditions, and applied loading. Ultimately, a closed-form analytical analysis method, such as the method used by SAGE, appears to be the most versatile for rockery design. Because this series of equations is based on gravity wall design methodology, the equations can be easily adapted to various site and soil conditions, vehicle surcharges, guardrail loads, and seismic loading conditions. This method can also be adapted to existing FHWA requirements for segmental gravity wall design. Moreover, these closed-form equations typically result in rockery base widths, B, on the order of 0.3H to 0.5H, which is consistent with the "rules of thumb" for most of the methods reviewed during this study.
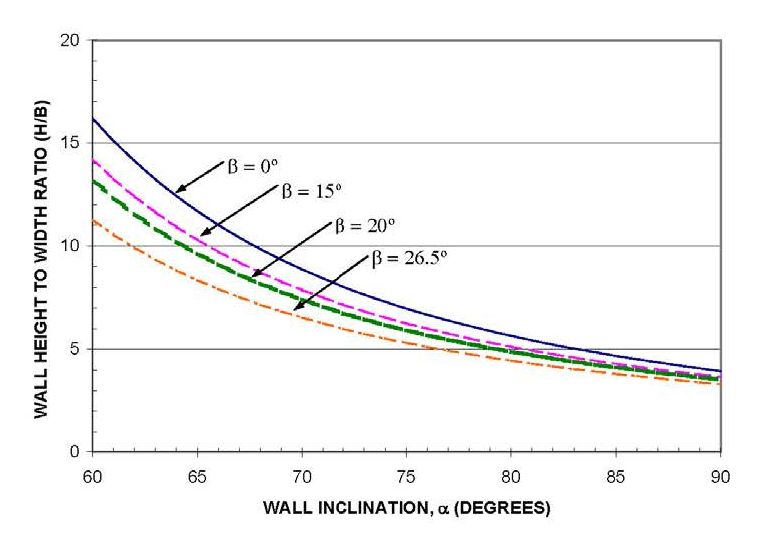
Figure 29. Chart. Typical chart plotting slope inclination (a) vs. height-to-base-width (H/B) ratio using the Gray & Sotir method. Chart developed for φ = 32º, γ = 18.8 kN/m3(120 pcf), and FS = 2.
View larger version of Figure 29.
An additional advantage of a closed-form method is that it can be adapted to unique situations, which gives the Design Engineer or Geotechnical Engineer flexibility. Because the method evaluates any driving or resisting forces acting on the rockery structure, the equations can be easily adapted to include forces other than lateral earth forces. Thus, the engineer is free to use engineering judgment when applying loads to the rockery system.
Protecting rockeries, which are generally used for erosion protection at the toe of slope or channel, are not the primary focus of this report. However, where slopes are inherently stable enough for the rockeries to be constructed as protecting rockeries, the use of smaller base rocks between 0.25H and 0.5H is acceptable. In this case, the rockery acts more like "organized riprap" than a retaining structure. In general, the rockeries can be considered protecting rockeries when the slope inclination is shallower than the potential failure envelope for a given friction angle, that is, α < (45º + φ/2) or ψ > (45º - φ/2). However, the Geotechnical Engineer should perform a global stability analysis using appropriate slope stability software to confirm the global stability of the soil slope.
The Hendron and Gray & Sotir methods appear to be most applicable for designing protecting rockeries. Because these methods are based on the evaluation of only one method of potential instability (overturning), they do not account for other failure mechanisms, such as sliding or seismic loading. Furthermore, these methods are based on a limited set of assumptions and are difficult to extrapolate to other design cases, such as seismic loading or traffic surcharges.
Stay up to date
Sign up for announcements on grant opportunities, training, and webinars.