


| AP | Availability Payment |
| BCA | Benefit Cost Analysis |
| BS | Balance Sheet |
| CF | Cash Flow |
| CFADS | Cash Flows Available to Debt Service |
| DSCR | Debt Service Coverage Ratio |
| DSRA | Debt Service Reserve Account |
| GPL | General Purpose Lanes |
| IRI | International Roughness Index |
| IRR | Internal Rate of Return |
| ML/TL | Managed Lanes or Tolled Lanes |
| MMRA | Major Maintenance Reserve Account |
| O&M | Operations and Maintenance |
| PDBCA | Project Delivery Benefit-Cost Analysis |
| P&L | Profit & Loss |
| PSC | Public Sector Comparator or Conventional Delivery |
| P3 | Public-Private Partnership |
| V/C | Volume/Capacity Ratio |
| VDF | Volume Delay Function |
| WACC | Weighted Average Cost of Capital |
This chapter discusses the modeling approach followed to develop P3-VALUE 2.2 as well as the tool's structure. Furthermore, it presents the different worksheets in the tool.
The P3-VALUE 2.2 tool follows international best modeling practices, ensuring transparency and a logical model flow from inputs through calculations to outputs. More specifically, the P3-VALUE 2.2 tool uses the FAST modeling standard (for more details, see: https://www.fast-standard.org). FAST models break down complex modeling problems into simple and easy-to-understand components. FAST stands for:
Some distinguishing features of FAST include:
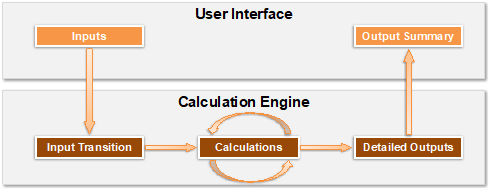
The FAST modeling standard minimizes the risk of errors and omissions and facilitates quality control and auditing. Furthermore, the FAST modeling standards help create a user-friendly and logical model structure, enabling the user to "read" the model and understand the full analysis, without necessarily having to understand all individual calculations. By adhering to the FAST modeling standards, the P3-VALUE 2.2 tool's calculations are transparent, thereby reducing the risk that users perceive the tool as a "black box". Furthermore, by adhering to FAST modeling standards, the P3-VALUE 2.2 tool can easily accommodate future adjustment or additions if required. Figure 2 shows how a model based on FAST standards maintains a strict separation of inputs, calculations, and outputs.
Figure 2: FAST Modeling Approach to User Interface Separation
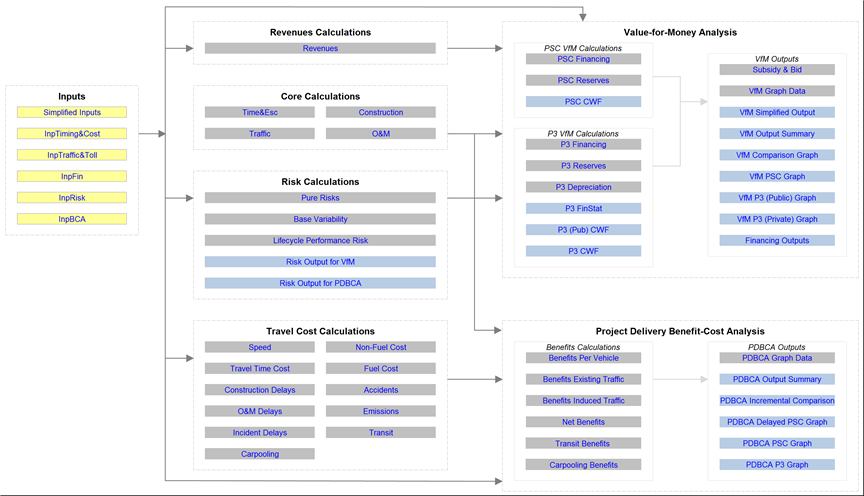
P3-Value detailed model structure
This figure is a detailed model structure for the P3-Value tool. It begins with Inputs, including Simplified Inputs, Input timing & cost, Input Traffic & Toll, Input Finance, Input Risk and Input BCA.
There are arrows from the inputs box to other boxes, including Value-for-Money Analysis, Revenues Calculations, Core Calculations, Risk Calculations, Travel Cost Calculations and Project Delivery Benefit-Cost Analysis.
Within the Revenues Calculations box there is only Revenues listed.
Within the Core Calculations box there are four listed sheets, including: Time&Esc, Traffic, Construction, and O&M.
Within the Risk Calculations box, five sheets are listed, including: Pure risks, base variability, lifecycle performance risk, risk output for VfM, and risk output for PDBCA.
Within the Travel Cost Calculations box there are eleven sheets listed, including: speed, non-fuel cost, travel time cost, fuel cost, construction delays, accidents, O&M delays, emissions, incident delays, transit and carpooling.
All previously listed boxes lead through arrows to the final two boxes: Value-for-Money Analysis and Project Delivery Benefit-Cost Analysis.
The Value-for-Money Analysis box contains three sub-boxes, including: PSC VfM Calculations, P3 VfM Calculations, and finally the VfM Outputs (which are derived from the previous two sub-boxes).
The PSC VfM Calculations sub-box contains three sheets, including: PSC financing, PSC reserves, and PSC CWF. The P3 VfM Calculations Sub-box contains six sheets, including: P3 financing, P3 reserves, P3 depreciation, P3 FinStat, P3 (Pub) CWF, and P3 CWF.
The final sub-box, VfM Outputs, contains nine sheets, including: Subsidy and bid, VfM graph data, VM simplified output, VfM output summary, VfM comparison graph, VfM PSC graph, VfM P3 (public) graph, VfM P3 (Private) graph, and financing outputs.
The last box is Project Delivery Benefit-Cost analysis. This includes two sub-boxes: Benefits Calculations and PDBCA Outputs. Benefits Calculations includes six sheets: Benefits per vehicle, benefits existing traffic, benefits induced traffic, net benefits, transit benefits, and carpooling benefits. These sheets are used to calculate the PDBCA outputs, which include: PDBCA Graph data, pdbca output summary, PDBCA incremental Comparison, PDBCA Delayed PSC Graph, PDBCA PSC graph, and finally PDBCA P3 graph.
The P3-VALUE 2.2 tool is organized into a number of modules. Each module has a specific objective. This modular approach enables users to "zoom" in on a specific issue without having to consult all other calculations and modules. The P3-VALUE 2.2 tool contains the following modules:
Each module has its own landing sheet, which visually presents how this module is connected to other modules. More specifically, the landing sheets show the following items:
Figure 3 presents the overall structure of the P3-VALUE 2.2 tool and the interactions between the different modules. For example, as can be seen by the arrows in the figure, the Value-for-Money Analysis module uses revenues, core calculations, and risks to calculate the VfM outputs. This structure is also presented on the home sheet of the P3-VALUE 2.2 tool. From the home sheet, users can access the various modules and sheets by double-clicking on the blue links.
Figure 3: P3-VALUE Detailed Model Structure
P3-Value detailed model structure
This figure is a detailed model structure for the P3-Value tool. It begins with Inputs, including Simplified Inputs, Input timing & cost, Input Traffic & Toll, Input Finance, Input Risk and Input BCA.
There are arrows from the inputs box to other boxes, including Value-for-Money Analysis, Revenues Calculations, Core Calculations, Risk Calculations, Travel Cost Calculations and Project Delivery Benefit-Cost Analysis.
Within the Revenues Calculations box there is only Revenues listed.
Within the Core Calculations box there are four listed sheets, including: Time&Esc, Traffic, Construction, and O&M.
Within the Risk Calculations box, five sheets are listed, including: Pure risks, base variability, lifecycle performance risk, risk output for VfM, and risk output for PDBCA.
Within the Travel Cost Calculations box there are eleven sheets listed, including: speed, non-fuel cost, travel time cost, fuel cost, construction delays, accidents, O&M delays, emissions, incident delays, transit and carpooling.
All previously listed boxes lead through arrows to the final two boxes: Value-for-Money Analysis and Project Delivery Benefit-Cost Analysis.
The Value-for-Money Analysis box contains three sub-boxes, including: PSC VfM Calculations, P3 VfM Calculations, and finally the VfM Outputs (which are derived from the previous two sub-boxes).
The PSC VfM Calculations sub-box contains three sheets, including: PSC financing, PSC reserves, and PSC CWF. The P3 VfM Calculations Sub-box contains six sheets, including: P3 financing, P3 reserves, P3 depreciation, P3 FinStat, P3 (Pub) CWF, and P3 CWF.
The final sub-box, VfM Outputs, contains nine sheets, including: Subsidy and bid, VfM graph data, VM simplified output, VfM output summary, VfM comparison graph, VfM PSC graph, VfM P3 (public) graph, VfM P3 (Private) graph, and financing outputs.
The last box is Project Delivery Benefit-Cost analysis. This includes two sub-boxes: Benefits Calculations and PDBCA Outputs. Benefits Calculations includes six sheets: Benefits per vehicle, benefits existing traffic, benefits induced traffic, net benefits, transit benefits, and carpooling benefits. These sheets are used to calculate the PDBCA outputs, which include: PDBCA Graph data, pdbca output summary, PDBCA incremental Comparison, PDBCA Delayed PSC Graph, PDBCA PSC graph, and finally PDBCA P3 graph.
Table 1 presents a comprehensive list of all P3-VALUE 2.2 worksheets and provides a short description of the purpose each sheet serves. Landing sheets for the various modules are shaded.
Table 1: Worksheets in P3-VALUE 2.2
| Sheet | Description |
|---|---|
| Home | This sheet presents the structure of the model and the interactions between the inputs, the calculation modules, and the outputs. |
| Sheets | This sheet presents on overview of all sheets contained in the tool. |
| Key | This sheet presents the key to the sheet tab colors, font colors, and cell shading in this spreadsheet model. |
| Inputs >> | This is the Inputs landing sheet. It presents the structure of the Inputs module and the interactions between the inputs and the calculation modules. |
| Simplified Inputs | This sheet contains a subset of all inputs contained in the detailed input sheets listed below, allowing users to perform a simplified high-level analysis. |
| InpTiming&Cost | This sheet contains project timing, cost, and escalation inputs. In addition, it contains non-changeable (constant) inputs, which are used throughout the model. |
| InpTraffic&Toll | This sheet contains traffic and tolling inputs, as well as roadway characteristics (lanes, free flow speed, etc.). |
| InpFin | This sheet contains financial inputs including subsidies, interest rates, target Debt Service Coverage Ratios (DSCRs), equity returns, reserve requirements, etc. |
| InpRisk | This sheet contains pure risk, base variability, lifecycle performance risk, and revenue uncertainty adjustment inputs. |
| InpBCA | This sheet contains all additional inputs required for BCA calculations. |
| Core Calculations >> | This is the Core Calculations landing sheet. It presents the structure of the Core Calculations module and the interactions between the inputs, the calculation modules, and the outputs. |
| Time&Esc | This sheet calculates the model's scenario timelines, which are used in all of the other sheets. It also contains flags and counters, which allow complex calculations to be broken up into smaller pieces. |
| Construction | This sheet calculates pre-construction and construction costs for each year in the analysis period for each delivery model: Public Sector Comparator (PSC or Conventional Delivery), Delayed Public Sector Comparator (Delayed PSC) and Public-Private Partnership (P3). |
| O&M | This sheet calculates operations and maintenance costs for each year in the analysis period for each delivery model (PSC, Delayed PSC, P3). |
| Traffic | This sheet calculates daily and annual traffic volumes for each year in the analysis period for both the No Build and each delivery model (PSC, Delayed PSC, P3). |
| Risk Assessment >> | This is the Risk Assessment landing sheet. It presents the structure of the Risk Assessment module and the interactions between the inputs, the calculation modules, and the outputs. |
| Pure Risks | This sheet calculates the pure risk cash flow for each delivery model (PSC, Delayed PSC, P3). |
| Base Variability | This sheet calculates base variability for the PSC, Delayed PSC, and P3 to create base variability cash flows. |
| Lifecycle Performance Risks | This sheet calculates the lifecycle performance risk premium and the revenue uncertainty adjustment for revenues flowing to the Agency. |
| Risk Output for VfM | This sheet contains the risk outputs used in the VfM module. |
| Risk Output for PDBCA | This sheet contains the risk outputs used in the PDBCA module. |
| Revenues Calculation >> | This is the Revenues Calculation landing sheet. It presents the structure of the Revenues Calculation module and the interactions between the inputs, the calculation modules, and the outputs. |
| Revenues | This sheet calculates the revenue cash flows for PSC and P3. |
| PSC VfM >> | This is the PSC VfM landing sheet. It presents the structure of the PSC VfM module and the interactions between the inputs, the calculation modules, and the outputs. |
| PSC Financing | This sheet calculates funding requirements, debt drawdown and repayment, and DSCR for the PSC. |
| PSC Reserves | This sheet calculates the PSC Major Maintenance Reserve Account and the PSC Debt Service Reserve Account. |
| PSC CWF | This sheet presents the PSC cash waterfall. The cash waterfall shows how revenues are used to pay operating costs, service debt, and fund reserves. |
| P3 VfM >> | This is the P3 VfM landing sheet. It presents the structure of the P3 VfM module and the interactions between the inputs, the calculation modules, and the outputs. |
| P3 Financing | This sheet calculates funding requirements, debt drawdown and repayment, and DSCR for the P3. |
| P3 Reserves | This sheet calculates the P3 Major Maintenance Reserve Account and P3 Debt Service Reserve Account. |
| P3 CWF | This sheet presents the P3 cash waterfall. The cash waterfall shows how revenues are used to pay operating costs, service debt, and fund reserves. |
| P3 Depreciation | This sheet calculates P3 asset depreciation. |
| P3 FinStat | This sheet contains the Income Statement and the Balance sheet. |
| P3 (Pub) CWF | This sheet presents the P3 cash waterfall from the public Agency's point of view. |
| VfM Outputs >> | This is the VfM Outputs landing sheet. It presents the structure of the VfM Outputs module and the interactions between the inputs, the calculation modules, and the outputs. |
| Subsidy & Bid | This sheet calculates the required subsidy/concession fee/availability payment to make the project viable. |
| VfM Graph Data | This sheet compiles the data to be used in the output graphs. |
| VfM Simplified Output | This sheet presents VfM outputs in a simplified table and figure. |
| VfM Output Summary | This sheet presents VfM outputs as summary tables and charts. |
| VfM Comparison Graph | This sheet presents VfM comparison between PSC and P3. |
| VfM PSC Graph | This sheet presents VfM outputs for the PSC. |
| VfM P3 (Public) Graph | This sheet presents VfM outputs for the P3 from the public perspective. |
| VfM P3 (Private) Graph | This sheet presents VfM outputs for the P3 from the private perspective. |
| Financing Outputs | This sheet presents the relevant PSC and P3 financing outputs. |
| Travel Cost Calculation >> | This is the Travel Cost Calculation landing sheet. It presents the structure of the Travel Cost Calculation module and the interactions between the inputs, the calculation modules, and the outputs. |
| Speed | This sheet calculates speeds for the No Build and each delivery model (PSC, Delayed PSC, P3). |
| Travel Time Cost | This sheet calculates travel time cost for the No Build and each delivery model (PSC, Delayed PSC, P3). |
| Construction Delays | This sheet calculates construction-related travel delays for the No Build and each delivery model (PSC, Delayed PSC, P3). |
| O&M Delays | This sheet calculates O&M-related travel delays for the No Build and each delivery model (PSC, Delayed PSC, P3). |
| Incident Delays | This sheet calculates incident delays for the No Build and each delivery model (PSC, Delayed PSC, P3). |
| Non-Fuel Cost | This sheet calculates non-fuel costs for the No Build and each delivery model (PSC, Delayed PSC, P3). |
| Fuel Cost | This sheet calculates fuel costs for the No Build and each delivery model (PSC, Delayed PSC, P3). |
| Accidents | This sheet calculates accident costs for the No Build and each delivery model (PSC, Delayed PSC, P3). |
| Emissions | This sheet calculates emission costs for the No Build and each delivery model (PSC, Delayed PSC, P3). |
| Transit | This sheet calculates daily and annual transit volumes for each year in the analysis period for the No Build and each delivery model (PSC, Delayed PSC, P3). |
| Carpooling | This sheet calculates daily and annual carpooling volumes for each year in the analysis period for the No Build and each delivery model (PSC, Delayed PSC, P3). |
| Benefits >> | This is the Benefits landing sheet. It presents the structure of the PDBCA module and the interactions between the inputs, the calculation modules, and the outputs. |
| Benefits Per Vehicle | This sheet calculates benefits for the PSC, Delayed PSC, and P3 by subtracting the costs accrued by a user in the No Build from the costs accrued by a user for the respective Build alternative for each year in the analysis period. |
| Benefits Existing Traffic | This sheet calculates benefits for existing traffic for the PSC, Delayed PSC, and P3 by multiplying the benefits per vehicle for each benefit type by existing traffic for each year in the analysis period. |
| Benefits Induced Traffic | This sheet calculates benefits for induced traffic for the PSC, Delayed PSC, and P3 by calculating consumer and producer surplus. |
| Transit Benefits | This sheet calculates transit benefits under the various delivery models. |
| Carpooling Benefits | This sheet calculates carpooling benefits under the various delivery models. |
| Net Benefits | This sheet calculates net benefits for each year in the analysis period for each build alternative (PSC, Delayed PSC, and P3). |
| PDBCA Outputs >> | This is the PDBCA Outputs landing sheet. It presents the structure of the PDBCA Outputs module and the interactions between the inputs, the calculation modules, and the outputs. |
| PDBCA Graph Data | This sheet compiles the data to be used in the output graphs. |
| PDBCA Output Summary | This sheet presents PDBCA outputs as summary tables and charts. |
| PDBCA Incremental Comparison | This sheet summarizes net benefits for each of the three steps in the PDBCA framework (Step1: Project BCA, Step2: Acceleration Effects, and Step3: P3 Delivery Effects) |
| PDBCA Delayed PSC Graph | This sheet presents a detailed benefit and cost graph for the Delayed PSC. |
| PDBCA PSC Graph | This sheet presents a detailed benefit and cost graph for the PSC. |
| PDBCA P3 Graph | This sheet presents a detailed benefit and cost graph for the P3. |
| Checks & Alerts | This sheet summarizes the different checks and alerts used in the model. |
| Navigation | This sheet is used by the Model Navigator to navigate to different sheets within the model. |
| HideUnhide | This sheet is used by the Model Navigator to switch between high-level, detailed-level and training view. |