This section describes the use of the simplified inputs sheet. Please
refer to Section 4 for a discussion of the detailed input sheets.
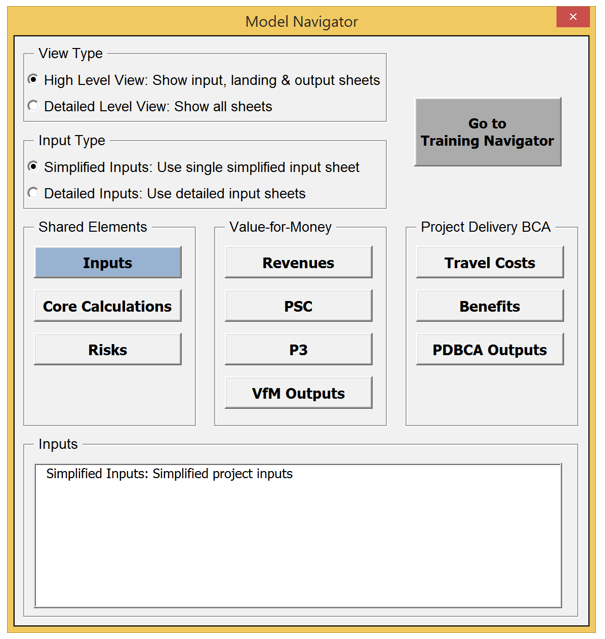
The simplified input sheet can be accessed through the Model Navigator.
The following panel with the simplified input sheet will appear upon
clicking on the Inputs button in the Model Navigator. Alternatively,
users can use the usual Excel navigation features to access the simplified
input sheet.
This model navigator shows simplified inputs selected.
The simplified input sheet contains three input sections:
Delivery, timing, cost & financing inputs
Traffic & toll inputs
Ramp-up & other inputs
Although each of the inputs used in the simplified input sheet are
also included in the detailed input sheets (see Section 4 for more details),
this section provides a brief description of the relevant inputs used
in the simplified input sheet.
Please note that under the simplified inputs option, no pure risk
or base variability inputs or calculations are considered. As such,
users should input risk- and uncertainty-adjusted costs where appropriate
(see Sections 3.1.3 and 3.1.4). Furthermore, the user does not have
access to the "Non Changeable Technical Inputs" described
in Section 4.1.4. Other differences between the simplified inputs option
and the detailed inputs will be highlighted where appropriate.
3.1 Delivery, Timing, Cost & Financing Inputs
In this section, users will provide inputs regarding the project's
delivery, timing, costs, and financing. Users will be required to input
data for the PSC and the P3 delivery models. For the Delayed PSC delivery
model, the user only needs to input start of pre-construction (see below),
with all other values assumed to be equal to the PSC. Users should input
data in the yellow-shaded cells. Under the simplified inputs option,
all costs are expressed in millions of dollars.
3.1.1 Project Delivery Inputs
Facility tolled?: Please enter whether the
facility will be tolled.
P3 delivery model: Please enter the P3 delivery
model (toll concession or availability payment transaction).
3.1.2 Project Timing Inputs
Pre-construction start year: Please confirm
the year pre-construction begins.
Pre-construction duration: Please enter the
pre-construction period duration (in whole years).
Construction duration: Please enter the construction
period duration (in whole years).
Operations duration: Please enter the operations
phase duration (in whole years).
3.1.3 Capital Cost Inputs (Risk Adjusted)
Public procurement cost: Please enter the amount
of the public procurement costs. These are costs incurred by the
Agency during the project preparation phase up to financial close,
including any compensation that may be given to losing bids.
Private procurement costs: Please enter the
cost incurred by the winning bidder.
Pre-construction cost: Please enter the risk-adjusted
pre-construction cost.
Construction cost: Please enter the risk-adjusted
construction cost.
For the various capital cost components under P3, the user has to
indicate how much of the costs are expected to be transferred from the
Agency to the P3 concessionaire.
3.1.4 Operational Cost Inputs (Risk Adjusted)
Annual routine O&M cost: Please enter the
annual routine O&M cost.
Major maintenance costs: Please enter the major
maintenance costs. For example, if the user expects a $10M major
maintenance investment every 10 years (in nominal dollar terms in
the indexation base year, see below), the input should be $10M.
The user will also be expected to provide the major maintenance
periodicity/frequency for the different delivery models. In this
case, the major maintenance periodicity would be 10 years.
Major maintenance frequency: Please enter the
major maintenance frequency (in whole years).
No Build annual O&M cost: Please enter
the No Build annual O&M cost. This cost is used to calculate
the No Build O&M cost savings achieved by doing the project.
The No Build annual O&M amount should include all operational
costs that will not have to be incurred if the project is undertaken,
including annualized costs of any contributions towards major maintenance.
For the various operational cost components under P3, the user has
to indicate how much of the costs are expected to be transferred from
the Agency to the P3 concessionaire.
Under the simplified inputs option, handback costs and the cost of
non-compensated losing bids (only used in the PDBCA module) are not
considered.
3.1.5 Financing Inputs
Subsidy/Milestone payment: Please input the
value of the upfront subsidy/milestone payment(s) available to the
project. The upfront subsidy/milestone payment(s) are assumed to
be paid out in the last year of construction.
Cost of equity - P3 only: Please input the
cost of equity (i.e., the "hurdle" equity rate of return)
for the P3 concessionaire (in percent).
Gearing - P3 only: Please input the gearing
for the P3 concessionaire (in percent, with the percentage reflecting
the debt share of the total financing amount).
Debt maturity from first construction period:
Please input the maturity for debt (in years), counting from the
first construction period to the last repayment period.
Debt interest rate: Please input the project
debt interest rate (in percent).
Equity bridge loan interest rate: Please input
the equity bridge loan interest rate (in percent). The equity bridge
loan is used to provide short-term financing that will be taken
out by any available government subsidy. The equity bridge loan
does not exist in the PSC as the Agency is assumed to prefinance
any subsidy.
Minimum required DSCR: Please input the minimum
Debt Service Coverage Ratio (as a ratio of cash flow available for
debt service in a given year divided by debt service for that year).
The model uses a single DSCR value. In practice, P3 projects typically
use multiple debt instruments. The value of the DSCR input should
reflect the ratio of cash flow available for debt service in a given
year divided by all combined debt service.
Interest rate on reserves: Please input the
interest rate for cash balance and reserve accounts (in percent).
Debt issuance/arrangement fee: Please input
the debt issuance/arrangement fee (as a percentage of the total
debt amount).
Under the simplified inputs option, P3-VALUE 2.2 makes the following
additional financing assumptions:
PSC is financed, as opposed to funded.
All debt is sculpted.
All debt has a six-month debt service reserve account (DSRA).
The following provides sample inputs for delivery, timing, cost,
and financing:
Project Configuration Inputs
PSC
P3
Facility tolled?
TRUE
P3 delivery model
/////////
Toll concession
Project Timing Inputs
PSC
P3
Pre-construction start year
2018
2018
Pre-construction duration (in years)
2 years
2 years
Construction duration (in years)
4 years
3 years
Operations duration (in years)
40 years
41 years
Delayed PSC pre-construction start year
2023
Capital Cost Inputs (Risk Adjusted)*
PSC
P3*
Public procurement cost (in million $)
$5.0M
$10.0M
0%
Private procurement cost (in million $)
$5.0M
$10.0M
100%
Pre-construction cost (in million $)
$25.0M
$22.5M
100%
Construction cost (in million $)
$400.0M
$367.5M
100%
Operational Cost Inputs (Risk Adjusted)*
PSC
P3*
Annual routine O&M cost (in million $/year)
$4.0M
$3.6M
100%
Major maintenance cost (in million $)
$10.0M
$9.0M
100%
Major maintenance frequency (in years)
8 years
8 years
No Build annual O&M cost savings (in million $/year)
$10.0M
Financing Inputs
PSC
P3
Subsidy/milestone payment (in million $)
$100.0M
$100.0M
Cost of equity (in percent)
/////////
12.00%
Gearing (in percent)
/////////
75.00%
Debt maturity (from start construction, in years)
35 years
30 years
Debt interest rate (in percent)
4.00%
6.00%
Equity bridge loan interest rate (in percent)
/////////
6.00%
Minimum required DSCR (multiple of debt service)
1.30x
1.30x
Interest rate on reserves (in percent)
2.00%
2.00%
Debt issuance/arrangement fee (in percent)
1.00%
1.00%
*P3 cost and cost share transferred
to P3 concessionaire
3.2 Traffic & Toll Inputs
In this section, users will provide inputs regarding the project's
projected traffic, tolls as well as other traffic characteristics.
3.2.1 Traffic Inputs
The model enables users to input bidirectional P50 (or most likely)
weekday traffic data for up to five different input years over the project
analysis period. Users must provide traffic data for the No Build and
Build (Managed Lanes or Tolled Lanes and General Purpose Lanes separately)
for the model start year. Users may also provide up to four additional
traffic data points by entering the relevant traffic data point year
and forecast. If the project is a simple toll road (as opposed to a
Managed Lanes facility), traffic inputs on the General Purpose Lanes
(GPL) should be zero. If the project is not tolled, traffic inputs on
the Managed Lanes or Tolled Lanes (ML/TL) should be zero. If the project
is a managed lane project, the user will input both tolled traffic (on
ML/TL) and non-tolled traffic (GPL). Please note that Build traffic
(Managed Lanes or Tolled Lanes and General Purpose Lanes traffic combined)
should be equal to or exceed No Build traffic.
Users are also expected to provide the annual traffic growth after
the last input year. This input is used to project traffic beyond the
last year of input. In the sample inputs below, "> 2050"
refers to traffic growth after 2050, the last year of input in the considered
example.
The following shows sample inputs for a project involving the expansion
of an existing facility to accommodate managed lanes along with free
GPLs. The units are thousands of vehicles per weekday.
Bidirectional P50 Traffic Inputs
Year
No Build
ML/TL
GPL
Weekday daily traffic in model start year (in thousands)
2017
120k
25k
105k
Weekday daily traffic in input year 2 (in thousands)
2020
127k
30k
110k
Weekday daily traffic in input year 3 (in thousands)
2030
138k
35k
121k
Weekday daily traffic in input year 4 (in thousands)
2040
150k
40k
131k
Weekday daily traffic in input year 5 (in thousands)
2050
158k
45k
142k
Annual traffic growth after last input year (in percent)
> 2050
0.50%
1.00%
0.50%
3.2.2 Toll Inputs
Users will need to input the toll rates for passenger cars and trucks/buses
for weekday peak, weekday off-peak and weekends, for the No-Build, ML/TL,
and GPL. The following shows sample inputs.
Toll Inputs
No Build
ML/TL
GPL
Passenger car toll rate - Weekday peak (in dollars)
$0.00
$4.00
$0.00
Passenger car toll rate - Weekday off-peak (in dollars)
$0.00
$2.00
$0.00
Passenger car toll rate - Weekend (in dollars)
$0.00
$2.00
$0.00
Truck/bus axle toll rate - Weekday peak (in dollars)
$0.00
$6.00
$0.00
Truck/bus axle toll rate - Weekday off-peak (in dollars)
No. of lanes per direction: Please input the
number of lanes per direction for the No Build, ML/TL and GPL.
Unidirectional peak traffic percentage (% of total traffic):
Please input the unidirectional peak traffic percentage, as a percentage
of total traffic.
Weekend traffic (% of weekday traffic):Please
enter weekend traffic, as a percentage of a typical weekday traffic.
Passenger car percentage - Peak/Off-peak/Weekend:
Please enter the passenger car percentage for the various time segments
(peak, off-peak, and the weekend). The trucks/buses percentage is
equal to 100% minus the passenger car percentage.
Highway free flow speed - Passenger car/Truck/bus (in
mph): Please enter the highway free flow speed for passenger
cars and trucks/buses, in miles per hour.
The following shows sample inputs for the above listed parameters.
Traffic Characteristics, Share & Speed Inputs
No Build
ML/TL
GPL
No. of lanes per direction
3 lanes
2 lanes
3 lanes
Unidirectional peak traffic percentage (% of total traffic)
30%
30%
30%
Weekend traffic (% of weekday traffic)
60%
60%
60%
Passenger car percentage - Peak (% of total traffic)
95%
100%
95%
Passenger car percentage - Off-peak (% of total traffic)
90%
100%
90%
Passenger car percentage - Weekend (% of total traffic)
95%
100%
95%
Highway free flow speed - Passenger car (in mph)
65 mph
70 mph
70 mph
Highway free flow speed - Truck/bus (in mph)
60 mph
65 mph
65 mph
3.2.4 Ramp-up & Other Inputs
Users will also need to provide the following ramp-up and traffic-related
inputs.
Ramp-up starting traffic (% of post-ramp up traffic):
Please input the ramp-up starting traffic, as a percentage of post-ramp
up traffic. For example, if traffic is expected to reach 50%, 80%,
90%, and 100% of post ramp-up traffic in year 1, 2, 3, and 4, respectively,
the ramp-up starting traffic is 50%.
Ramp-up period duration (in years): Please
input the ramp-up period duration, in years. Borrowing from the
example above, the ramp-up period duration would be four years.
Toll revenue leakage (in percent):Please enter
the toll revenue leakage, as a percentage of total anticipated toll
revenues.
No. of unidirectional peak hours in a day (during AM,
PM or combined): Please enter the number of unidirectional
peak hours in a day. For example, a radial highway may experience
an AM peak period of 3 hours in the direction of the central business
district while a circumferential highway may experience an AM peak
period of 3 hours and a PM peak period of 3 hours, i.e. a total
of 6 hours of peak traffic.
No. of unidirectional off-peak hours in a day:
Please enter the number of unidirectional off-peak hours in a day.
Typically, the amount of traffic carried by the roadway during the
night (e.g., between 12:00 AM and 6:00 AM) is insignificant. Therefore,
assuming a 3-hour peak period and 6 hours of insignificant night
traffic, the off-peak period would be 15 hours. The model requires
users to input only the number of hours with significant traffic
in order to ensure that off-peak congested speed is representative
of real world conditions.
The following shows sample inputs for the above listed parameters.
Ramp-Up & Other Inputs
Ramp-up starting traffic (% of post-ramp up traffic)
50%
Ramp-up period duration (in years)
5 years
Toll revenue leakage (in percent)
1.00%
Segment length (in miles)
20 miles
No. of unidirectional peak hours in a day (during AM, PM
or combined)
3 hours
No. of unidirectional off-peak hours in a day
15 hours
Under the simplified inputs option, P3-VALUE 2.2 assumes that the "Traffic
sensitivity factor for PDBCA (applies to traffic above No Build base
year traffic)" is 100% (see Section 4.2.4 for a discussion of this
input). Furthermore, the model adopts the preset values for the following
inputs (see Section 4 for more details):
Weekdays in a year
Volume delay function parameters
Lane vehicle capacity at LOS C
Hourly-to-daily capacity conversion factor
Ratio of LOS E capacity to LOS C capacity
3.3 Other Inputs
In this section, users will provide inputs regarding the project's
benefits and costs, taxation, competitive neutrality adjustment, inflation,
discount rates, lifecycle performance risks and revenue uncertainty
adjustment.
3.3.1 Benefit Cost Inputs
Under the simplified inputs option, P3-VALUE 2.2 requires the user
to provide a limited number of benefit-cost-related inputs, including:
Average duration of construction and O&M activity:
Please provide the average duration of construction or O&M activities
(in hours per construction or O&M day). This input impacts the
travel time cost calculation of the No Build, ML/TL and GPL.
Speed adjustment factor: Please provide the
speed adjustment factor for incident delays (in percent reduction
of the average speed prior to consideration of incident delays).
This input impacts the travel time cost calculation of the No Build,
ML/TL and GPL.
Pavement quality (IRI, in inch/mile): Please
provide the pavement quality, using the International Roughness
Index (IRI), measured in inches per mile. The pavement quality impacts
the vehicle operating costs.
Additional passengers carried by transit (% of vehicles):
Please provide the additional passengers carried by transit, as
a percentage of number of vehicles. This input helps calculate the
additional societal benefits from potentially lower travel time
cost for transit passengers.
Additional passengers carried by carpools (% of vehicles):
Please provide the additional passengers carried by carpools, as
a percentage of number of vehicles. This input helps calculate the
additional societal benefits from potentially lower travel time
cost for carpooling passengers.
The following shows sample inputs for the above listed parameters.
Benefit Cost Inputs (Delays & Pavement Quality)
No Build
PSC
P3
Average duration of construction activity (in hours)
0.00 hours
8.00 hours
7.50 hours
Average duration of O&M activity (in hours)
4.00 hours
3.00 hours
2.75 hours
Speed adjustment factor for incident delays (in percent)
18.00%
9.00%
8.50%
Pavement quality (IRI, in inch/mile)
150 inch/mile
140 inch/mile
130 inch/mile
Benefit Cost Inputs (Transit & Carpool)
No Build
ML/TL
GPL
Additional passengers carried by transit (% of vehicles)
2.00%
4.00%
1.50%
Additional passengers carried by carpools (% of vehicles)
2.00%
4.00%
1.50%
Under the simplified inputs option, the model adopts the values from
the detailed input sheets for the following inputs (see Section 4 for
more details):
Frequency of construction and O&M delays
Affected segment length and speed adjustment for construction
and O&M delays
Accident cost inputs
Vehicle occupancy
Value of time
Vehicle operating costs
Pavement quality adjustment on fuel and non-fuel costs
Vehicle speed adjustment on fuel and emission costs
Tax rate (in percent): Please provide the state
and Federal tax rate, as a percentage of profit.
Tax considered for competitive neutrality adjustment?:
Please indicate whether taxes should be added to the P3 net costs
to as part of a competitive neutrality adjustment to allow for an
apples-to-apples comparison.
Value of construction self-insurance (% of transferred
construction costs): Please enter the value of construction
self-insurance to be added to the P3 net costs as part of a competitive
neutrality adjustment to allow for an apples-to-apples comparison.
Value of O&M and major maintenance self-insurance
(% of transferred O&M costs): Please enter the value
of O&M and major maintenance self-insurance to be added to the
P3 net costs to as part of a competitive neutrality adjustment to
allow for an apples-to-apples comparison.
Value of credit subsidy or tax benefits under PSC delivery
(in million $): Please enter the value of any credit subsidy
or tax benefit available to the project under PSC delivery. Examples
of credit subsidies or tax benefits include TIFIA loans and tax-exempt
municipal bonds.
Value of credit subsidy or tax benefits under P3 delivery
(in million $): Please enter the value of any credit subsidy
or tax benefit available to the project under P3 delivery. Examples
of credit subsidies or tax benefits under P3 delivery include TIFIA
loans and tax-exempt PABs financing.
The following shows sample inputs for the above listed parameters.
Taxation Inputs
State
Federal
Tax rate (in percent)
10.00%
25.00%
Tax considered for competitive neutrality adjustment?
TRUE
TRUE
Competitive Neutrality Adjustment Inputs
Value of construction self-insurance (% of transferred
construction costs)
0.00%
Value of O&M and major maintenance self-insurance
(% of transferred O&M costs)
0.00%
Value of credit subsidy or tax benefits under
PSC delivery (in million $)
$0.0M
Value of credit subsidy or tax benefits under
P3 delivery (in million $)
$0.0M
Under the simplified inputs option, P3-VALUE 2.2 assumes that tax
benefits due to the effects of depreciation can be passed on to the
parent company ("tax pass-through), meaning that no tax losses
need to be brought forward.
3.3.3 Inflation & Discount Rate Inputs
Indexation and NPV base year: Please input
the indexation and NPV base year. All NPV output values are expressed
in the NPV base year value.
Indexation rate for construction, operations, tolls &
subsidy (in percent): Please input the indexation rate
for construction, operations, tolls & subsidy, in percent annual
increase.
Allowable share of indexed O&M component in availability
payment (in percent): Please input the allowable share
of indexed O&M cost as a percentage of the overall availability
payment.
Indexation rate for O&M component of availability
payments (in percent): Please input the indexation rate
for the O&M component of the availability payments, in percent
annual increase.
Nominal discount rate (in percent, used for VfM):
Please input the nominal discount rate, used for the Value for Money
analysis.
Real discount rate (in percent, used for BCA):
Please input the real discount rate, used for the benefit-cost analysis.
The following shows sample inputs for the above listed parameters.
Inflation & Discount Rate Inputs
Indexation and NPV base year
2018
Indexation rate for construction, operations, tolls &
subsidy (in percent)
2.00%
Allowable share of indexed O&M component in availability
payment (in percent)
20.00%
Indexation rate for O&M component of availability payments
(in percent)
Lifecycle performance risk calculation method (see options
below): Please select from the options which lifecycle
performance risk calculation method you want to use. The options
are:
Option 1: Use P3-VALUE 2.2's WACC-based risk premium calculation
to determine the value of lifecycle performance risks.
Option 2: Use user-specified risk premium for the value
of lifecycle performance risks.
Option 3: Do not value lifecycle performance risks; lifecycle
performance risks are ignored in the analysis.
Lifecycle performance risk aggregate premium (in million
$, option 2 only): Please input the lifecycle performance
risk aggregate premium over the life of the project. This input
is only used if option 2 under the previous input is selected.
Revenue uncertainty adjustment calculation method (see
options below): Please select from the options which revenue
uncertainty adjustment calculation method you want to use. The options
are:
Option 1: Use P3-VALUE 2.2's WACC-based risk premium calculation
to determine the value of revenue uncertainty adjustment.
Option 2: Use user-specified risk premium for the value
of revenue uncertainty adjustment.
Option 3: Do not value revenue uncertainty adjustment; revenue
uncertainty is ignored in the analysis.
Delta between availability payment & toll concession
WACC (in percent, option 1 only): Please input the difference
in the weighted average cost of capital (WACC) if the project were
to be implemented 1) as an availability payment transaction or 2)
as a toll concession. This difference in WACC will be used to value
the revenue uncertainty if option 1 is selected.
Revenue uncertainty adjustment (% of toll revenue collection,
option 2 only): Please input the revenue uncertainty adjustment,
expressed as a percentage of total toll revenue collection. This
revenue percentage will be used to value the revenue uncertainty
if option 2 is selected.
The following shows sample inputs for the above listed parameters.