


| AP | Availability Payment |
| BCA | Benefit Cost Analysis |
| BS | Balance Sheet |
| CF | Cash Flow |
| CFADS | Cash Flows Available to Debt Service |
| DSCR | Debt Service Coverage Ratio |
| DSRA | Debt Service Reserve Account |
| GPL | General Purpose Lanes |
| IRI | International Roughness Index |
| IRR | Internal Rate of Return |
| ML/TL | Managed Lanes or Tolled Lanes |
| MMRA | Major Maintenance Reserve Account |
| O&M | Operations and Maintenance |
| PDBCA | Project Delivery Benefit-Cost Analysis |
| P&L | Profit & Loss |
| PSC | Public Sector Comparator or Conventional Delivery |
| P3 | Public-Private Partnership |
| V/C | Volume/Capacity Ratio |
| VDF | Volume Delay Function |
| WACC | Weighted Average Cost of Capital |
Upon opening P3-VALUE 2.2, click "enable editing" and/or "enable content" on the yellow bar across top of screen to enable critical macros built into the model. The form below will appear when the model is opened and prompts the user to select either the "Model Navigator" or "Training Navigator". The "Training Navigator" contains four modules that provide access to only the relevant inputs and outputs in a training session, while the "Model Navigator" enables the user to access all the modules and sheets in the tool.
If "Model Navigator" is selected, the following user form will appear. If the user wishes to switch to the Training Navigator, he or she may do so by clicking the "Go to Training Navigator" button on the top right.
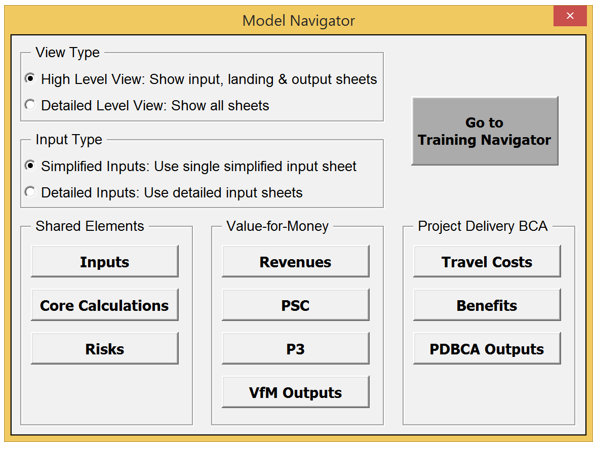
Model Navigator
This screenshot of the Model Navigator includes: view type, which can be high level or detailed view; input type, which can be simplified or detailed; shared elements, which includes inputs, core calculations, and risks; value-for-money, which includes revenues, PSC, P3, and VfM outputs; and finally Project delivery BCA, which includes travel costs, benefits, and PDBCA outputs.
There is also a button to 'go to training navigator'.
The user can exit the Navigator at any point by clicking on the exit "X" at the top right corner of the Navigator. To access the Navigator again, simply click on the "Navigator" button on the toolbar (see below).
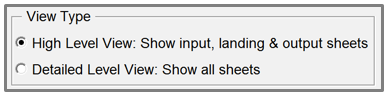
View Type
This small screenshot shows the view type selector, with options of high level view (which shows input, landing and output sheets) or detailed level view (which shows all sheets).
The Model Navigator has two different view options: a high-level and a detailed-level view. Users can choose between the high-level view and detailed-level view using the radio buttons at the top left of the Navigator.
In the high-level view, the user has access only to the inputs, landing sheets (see discussion below) and outputs. Detailed calculation sheets are hidden to provide the user with overall understanding of the model flow and logic. By clicking on any of the buttons in the high-level view, the Model Navigator will either list the relevant input sheets (for the "Inputs" button), output sheets (for the "Risks", "VfM Outputs" and "PDBCA Outputs" buttons) or take the user to the relevant landing sheet (for all other buttons). For the listed input and output sheets, the user can click on them to navigate to these sheets.
In the detailed-level view, all sheets are visible and accessible to the user. By clicking on any of the buttons in the detailed-level view, the Model Navigator will list all relevant worksheets. The screenshot below shows what the user will see if he or she clicks on the P3 button (in the Value-for-Money section).
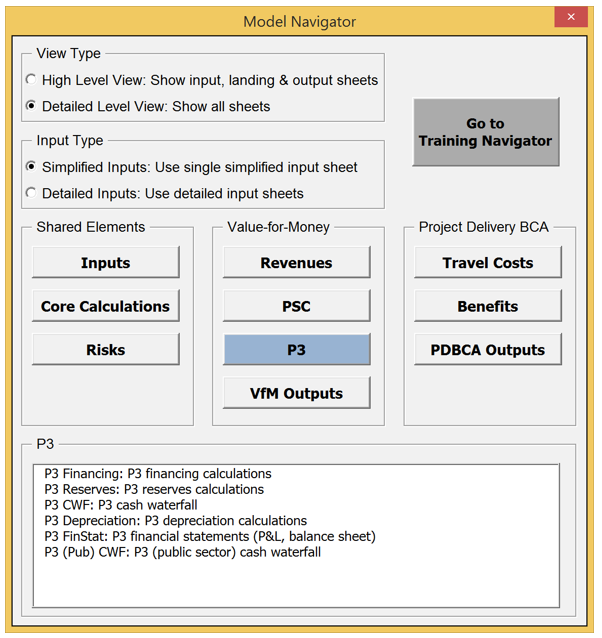
Model Navigator
This screenshot of the model navigator shows the additional detail available when option P3 under the Value-for-Money selection is selected. The P3 button makes a menu appear with options of 6 sheets: P3 financing calculations; P3 reserves calculations; P3 CWF (cash waterfall); P3 Depreciation calculations; P3 FinStat (financial statements; and P3 public sector cash waterfall.
The user can click on any of the listed worksheets to navigate to a particular worksheet. While the high-level view enables the user to navigate the model through landing sheets, the detailed-level view enables the user to navigate to each individual sheet in the model. Chapters 0, 4, and 6 of the User Guide describe the input and outputs of the model (accessible in both high-level and detailed-level view), whereas chapter 5 discusses the model's calculations (accessible in detailed-level view only).
The Model Navigator has two different input options: simplified inputs and more comprehensive detailed inputs. The users can choose between the simplified input and detailed input options using the radio buttons at the top left of the Navigator, just below the view type buttons.
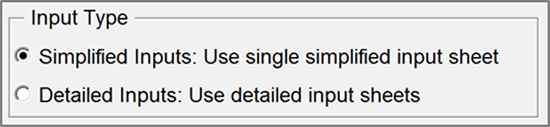
Input type
This small screenshot shows the input type options: simplified inputs (use single simplified input sheet) or detailed inputs (use detailed input sheets)
The simplified inputs option allows the user to perform a simplified high-level analysis without having to enter all inputs used by P3-VALUE 2.2. When using the simplified inputs, the user has access to a subset of all inputs contained under the detailed input option. Specifically, the simplified inputs exclude all inputs associated with pure risks and base variability. As such, cost inputs must be risk-adjusted costs when using the simplified inputs. Furthermore, the user does not have access to all BCA inputs under the simplified inputs option.
The simplified inputs are discussed in Section 3 whereas the detailed inputs are covered in Section 4.
The Model Navigator is organized into three panels, which in turn provide access to different modules:
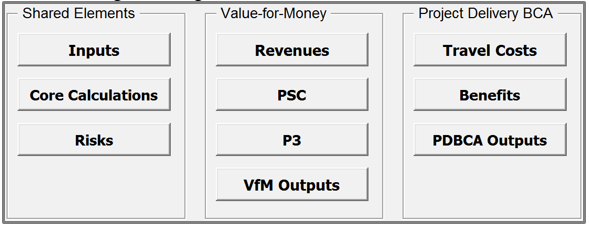
Modules from model navigator
This screenshot of the Model Navigator includes: shared elements, which includes inputs, core calculations, and risks; value-for-money, which includes revenues, PSC, P3, and VfM outputs; and finally Project delivery BCA, which includes travel costs, benefits, and PDBCA outputs.
The following section describes the different modules.
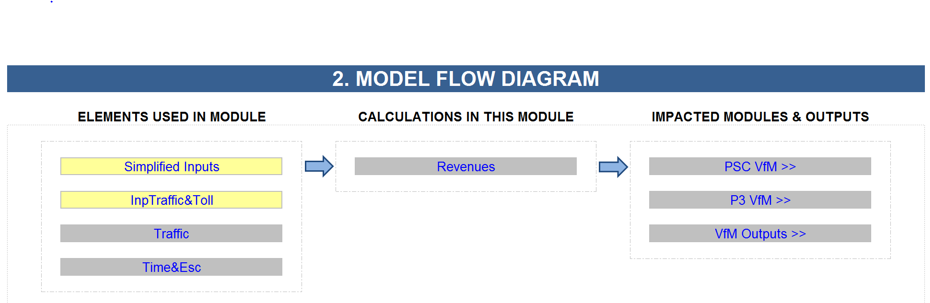
This section describes the various modules and landing sheets that are accessible from the Model Navigator. Each of the tool's modules has a landing sheet. The landing sheets provide an overview of the module's components (elements used as inputs to the calculations in the module, calculations carried out within the module, and a list of outputs and modules that are affected by this module's calculations) in a flow chart format. As an example, the screenshot below shows the landing sheet for the Revenues module. Please see Section 2.5 for the key to color codes used in the diagram and throughout the model.

Model Flow Diagram
This figure shows the Model Flow Diagram for the Revenues model of the tool. It shows the following Elements Used in Module: Simplified Inputs; InpTraffic&Toll; Traffic; Time&Esc
These elements lead to Calculations in the Model: Revenues
These elements lead to Impacted Modules & Outputs: PSC VM; P3 VFM; VFM Outputs There is also a button to 'go to training navigator'.
The landing sheet can also be used to navigate the model. To access the landing sheet, click on any button in the high-level view. By double clicking on any of the sheet names listed on the landing sheet, the user will be taken to the selected sheet. This functionality works both in the high-level and detailed-level view (in the high-level view, the selected sheet will in fact be unhidden to be visible to the user). The remainder of this section will present the various modules and their landing sheets.
After selecting the preferred input type (simplified inputs or detailed inputs), click on the Inputs button on the Model Navigator to navigate to the various input sheets. The Inputs Module contains the inputs that will be used throughout the model to carry out the required calculations. The screenshot below shows how the input sheets can be directly accessed from the Model Navigator (both in high-level and detailed-level view).
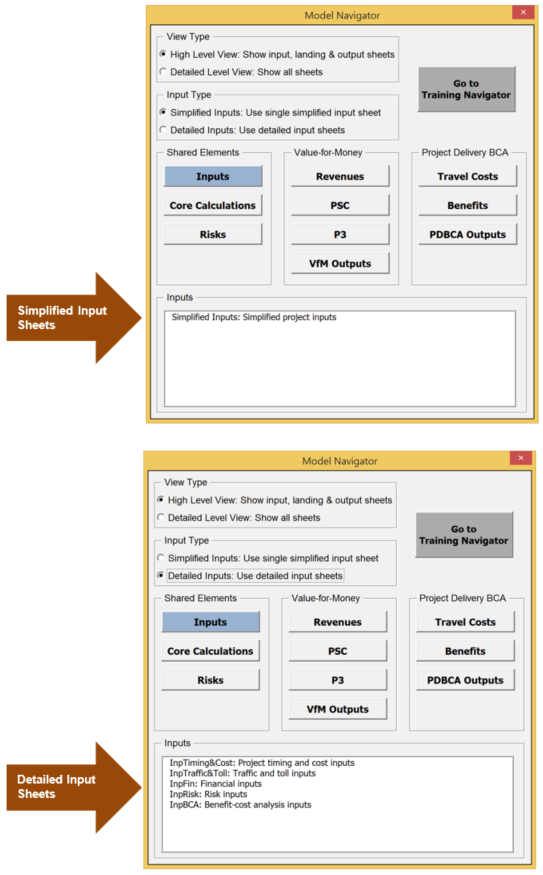
Model Navigator
This view of the model navigator shows the detailed input sheets available, including: input timing & costs, input traffic and toll, input financials, input risk and input BCA.
Click on the Core Calculations button on the Model Navigator to navigate to the Core Calculations landing sheet in the high-level view, or to one of the calculation sheets in the detailed-level view. The Core Calculation Module contains the calculation of items that are used frequently throughout the model: flags, indexations, traffic, and costs. The following presents the Core Calculations landing sheet.
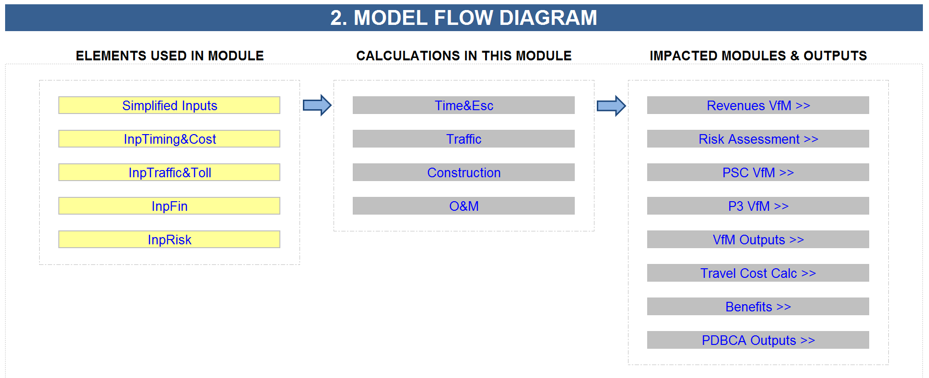
Model Flow Diagram
This version of the model flow diagram for the core calculations shows elements used in the module including: simplified inputs, input timing and cost, input traffic and toll, input finance, and input risk. Calculations in this module include: time and esc, traffic, construction and O&M. Impacted modules and outputs include revenues VfM, risk assessment.
Click on the Risks button on the Model Navigator to navigate to the Risks Assessment landing sheet in the high-level view, or to one of the calculation sheets in the detailed-level view. The P3-VALUE 2.2 Risk Assessment Module demonstrates how quantitative risk assessments may be conducted as a part of a VfM assessment and PDBCA. P3-VALUE 2.2 distinguishes three different types of risks: Pure risks, base variability, and lifecycle performance risk. The following presents the Risks Assessment landing sheet.
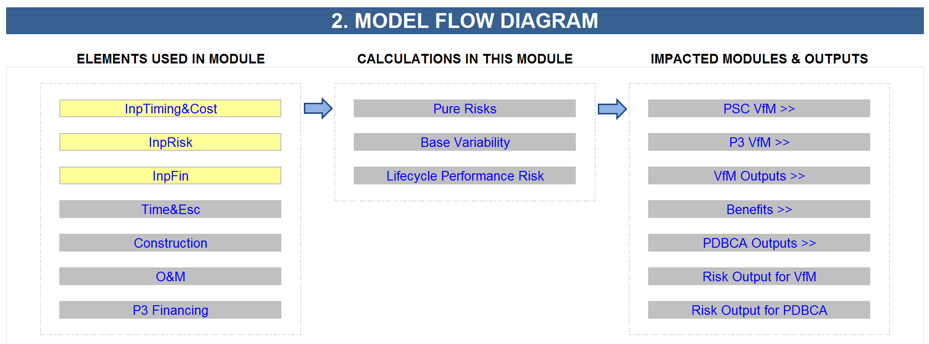
Model Flow Diagram
This image of the model flow diagram for the risks module shows elements in the module including: input timing and cost, input risk, input finance, time and esc., construction, O&M, and P3 financing.
Calculations in this module include pure risks, base variability, and lifecycle performance risk. Impacted modules and outputs include PSC VfM, P3 VfM, VfM Outputs, benefits, PDBCA outputs, Risk output for VfM, and risk output for PDBCA.
Click on the Revenues button on the Model Navigator to navigate to the Revenues VfM landing sheet in the high-level view, or to the revenue calculation sheet in the detailed-level view. The Revenues Calculation Module calculates the toll revenues for the project. These revenues are only used in VfM assessment and not in PDBCA. The following presents the Revenues landing sheet.
Model Flow diagram
This screenshot shows the model flow diagram for the Revenues module. Elements used in module included simplified inputs, input traffic and toll, traffic, and time and Esc. The calculations in this model included revenues, and the impacted modules and outputs included PSC VfM, P3 VfM, and VfM outputs.
Click on the PSC button on the Model Navigator to navigate to the PSC VfM landing sheet in the high-level, or to one of the calculation sheets in the detailed-level view. The PSC module of the VfM assessment demonstrates how the PSC may be analyzed as part of a quantitative VfM. The following presents the PSC landing sheet.
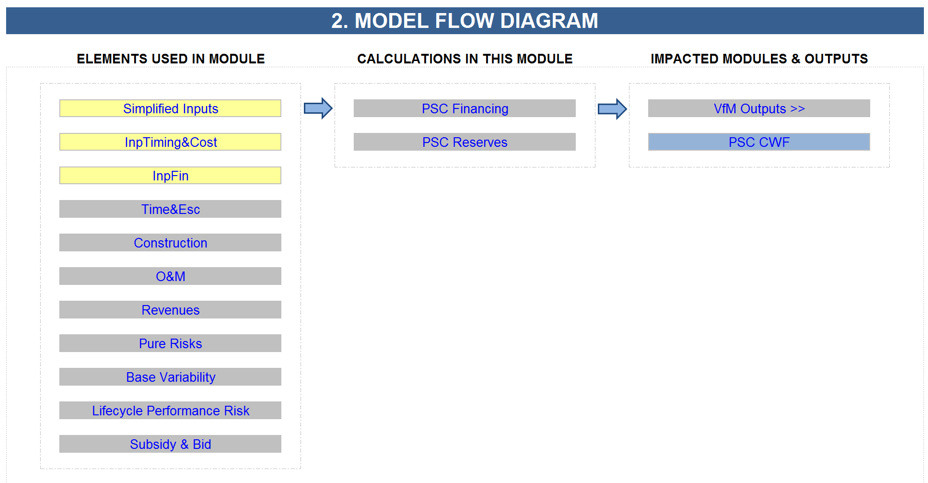
Model Flow diagram
This model flow diagram for the PSC module includes elements simplified inputs, input timing and cost, input finance, time and esc., construction, O&M, revenues, pure risks, base variability, lifecycle performance risk, and subsidy and bid.
Calculations in this module include PSC financing and PSC reserves.
Impacted Modules and outputs include VfM outputs and PSC CWF.
Click on the P3 button on the Model Navigator to navigate to the P3 VfM landing sheet in the high-level, or to one of the calculation sheets in the detailed-level view. The P3 module of the Value-for-Money (VfM) assessment demonstrates how the P3 may be analyzed as part of a quantitative VfM. The following presents the P3 landing sheet.
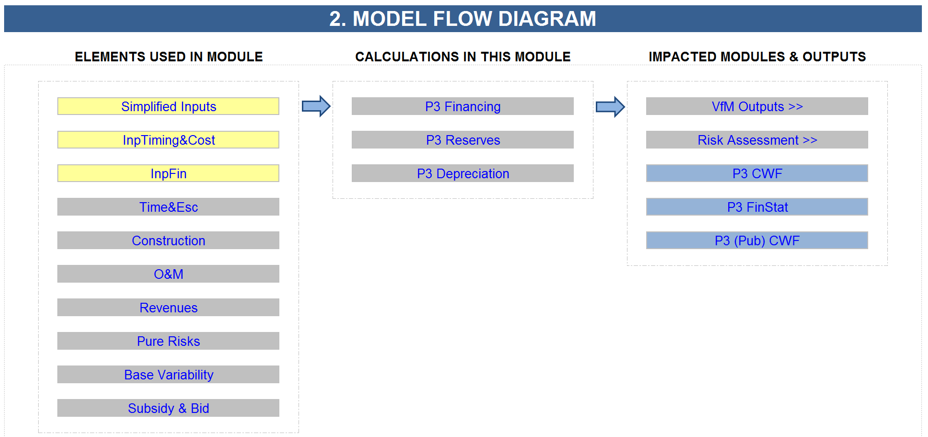
Model Flow diagram
This model flow diagram for the P3 module contains elements used in the module including: simplified inputs, input timing and cost, input finance, time and esc., construction, O&M, revenues, pure risks, base variability, and subsidy and bid.
Click on the VfM Outputs button on the Model Navigator to navigate to the various output sheets. The output section of the VfM assessment compares the cost and revenues of the PSC to the costs and revenues of the P3. It calculates the required subsidy (PSC and P3), Concession Fee for the P3, or Availability payment for the P3 and compares cash flow to/from Agency under PSC and P3. The screenshot below shows how the VfM output sheets can be directly accessed from the Model Navigator (both in high-level and detailed-level view 2).
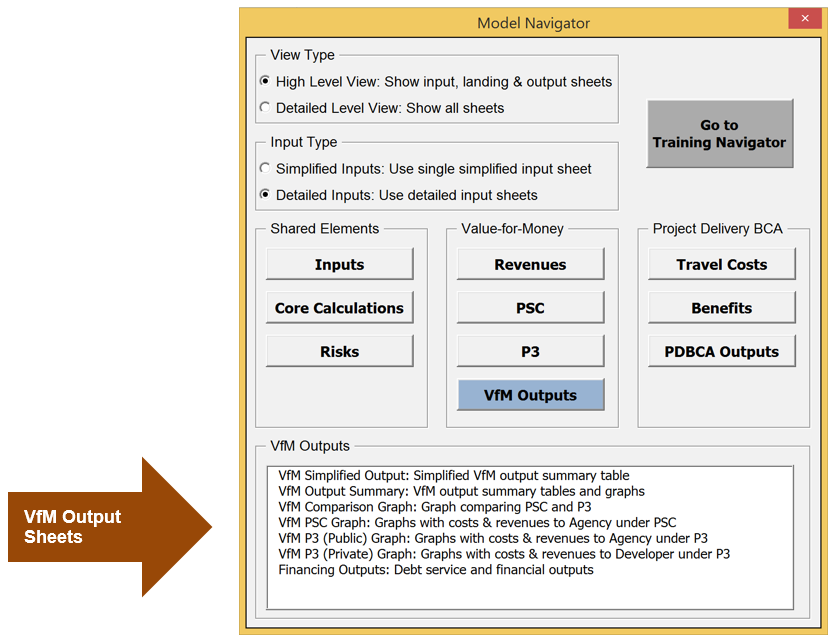
Model Navigator
This version of the model navigator shows the sheets included in the detailed VfM outputs, including: Vfm simplified output, VfM output summary, VfM comparison graph, VfM PSC graph, VfM P3 public graph, VfM P3 private graph, and financing outputs.
Click on the Travel Costs button on the Model Navigator to navigate to the Travel Costs Calc landing sheet in the high-level view, or to one of the calculation sheets in the detailed-level view. This module calculates different economic travel costs for the No Build, Delayed PSC, PSC, and P3 in order to be able to compare them in the PDBCA. These travel costs include:
To be able to calculate some of these benefits, the model also calculates speeds for the No Build, Delayed PSC, PSC, and P3. The following presents the Travel Costs landing sheet.
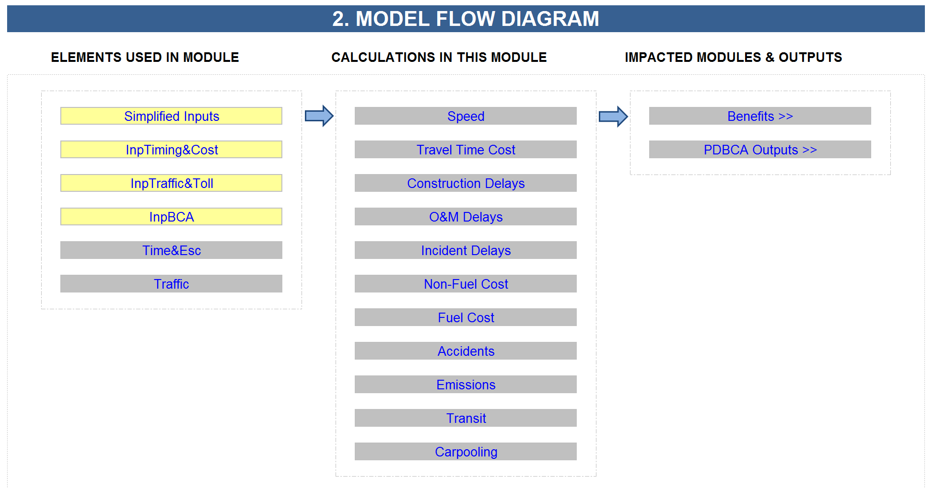
Model Flow diagram
This model flow diagram for the Travel Costs module shows elements used in module including simplified inputs, input timing and costs, input traffic and toll, input BCA, input time and esc., and traffic.
Calculations in this module include speed, travel time cost, construction delays, O&M delays, incident delays, non-fuel cost, accidents, emissions, transit, and carpooling.
Impacted modules and outputs include benefits and PDBCA outputs.
Click on the Benefits button on the Model Navigator to navigate to the Benefits landing sheet in the high-level view, or to one of the calculation sheets in the detailed-level view. This module uses the calculated economic travel costs to determine the economic benefits of the Delayed PSC, PSC and P3 compared to the No Build. The following presents the Benefits landing sheet.
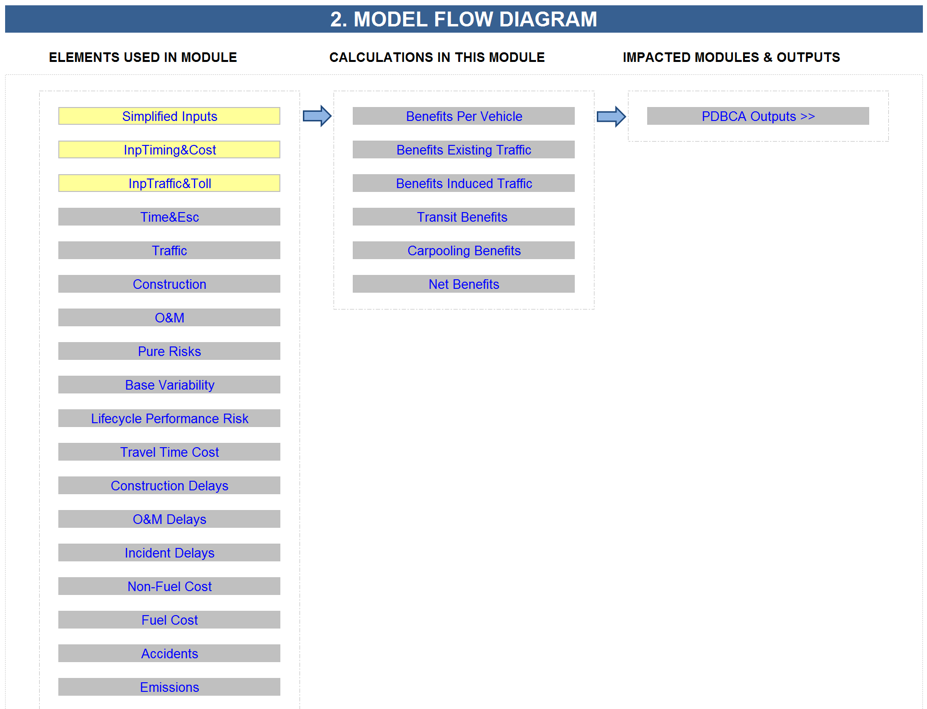
Model Flow diagram
This model flow diagram for the benefits module shows elements used in module including: simplified inputs, input timing and cost, input traffic and toll, time and esc., traffic, construction, O&M, pure risks, base variability, lifecycle performance risk, travel time cost, construction delays, O&M delays, incident delays, non-fuel cost, fuel cost, accidents, and emissions.
Calculations in this module include benefits per vehicle, benefits existing traffic, benefits induced traffic, transit benefits, carpooling benefits, and net benefits.
Impacted modules and outputs includes PDBCA outputs.
Click on the PDBCA Outputs button on the Model Navigator to navigate to the various output sheets. This module presents the outputs of the Project Delivery Benefit-Cost Analysis, in which the economic net benefits of the Delayed PSC, PSC and P3 are compared. The screenshot below shows how the PDBCA output sheets can be directly accessed from the Model Navigator (both in high-level and detailed-level view 3).
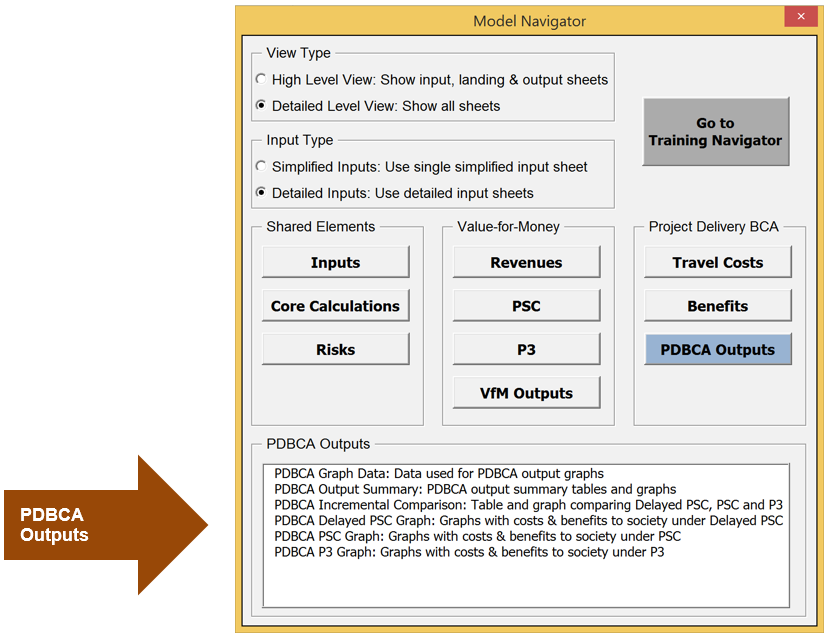
Model Navigator
This module navigator screenshot displays the PDBCA detailed output sheets, including: PDBCA graph data, PDBCA output summary, PDBCA incremental comparison, PDBCA delayed PSC graph, PDBCA PSC graph, and PDBCA P3 graph.
The model also contains a toolbar that is visible in all worksheets. The toolbar contains the following three buttons:

The user can use the toolbar to navigate or optimize the model:
The P3-VALUE 2.2 tool includes a full financing structure for both the Conventional Delivery and P3. Due to significant interdependence between the different elements of the financing and funding structure (e.g. the role of subsidies in determining the financing requirement and the optimal financing structure), as well as other parts of the model (in particular, the lifecycle performance risk calculation discussed below), many of the calculations need to be performed iteratively to arrive at the optimal financing structure. To determine the financing structure, the user needs to provide the gearing as an input. Based on this, the Model Optimizer uses a set of macros to determine the lowest possible bid (for P3) and the lowest possible subsidy (for Conventional Delivery).
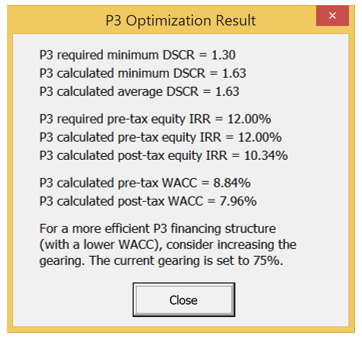
P3 Optimization Result
This screenshot of the results of the P3 Optimization display the typical layout of results, including all data outputs.
The Model Optimizer calculates the optimal subsidy/concession fee (for a toll concession) or availability payment, subject to a given gearing, using an iterative optimization approach for the P3. In this context, "optimal" means the lowest possible cost to the Agency while simultaneously satisfying the following two requirements:
The Model Optimizer iteratively adjusts the subsidy/concession fee or availability payment (depending on which P3 structure is selected) until both criteria are satisfied. Further increasing the subsidy/concession fee or availability payment would result in unnecessary high returns for the equity investor and/or unnecessary high minimum DSCR values. Decreasing the subsidy/concession fee or availability payment would result in the target equity return or minimum DSCR not being met. Given the inputs (including the gearing), the optimized result will be the most efficient solution with the lowest Weighted Average Cost of Capital (WACC).
It may, however, be possible to obtain a more efficient financing solution (with a lower WACC) by changing the gearing. This is particularly relevant when the calculated DSCR significantly exceeds its target value (while the calculated equity IRR is equal to its target value), or when the calculated equity IRR significantly exceeds its target value (while the calculated DSCR is equal to its target value). In that case, adjusting the gearing can further lower the required subsidy/concession fee or availability payment. To help the user in this process, the Model Optimizer provides guidance to the user on how to potentially change the gearing to find a more efficient financing solution at the end of the optimization cycle (see sample P3 optimization result on the right). It should be noted, however, that debt providers have strict limitations on gearing and minimum DSCR, so users should make sure that the selected gearing (as well as other financing conditions) is consistent with market practice.
For Conventional Delivery, the Model Optimizer uses an iterative approach to optimize the minimum subsidy amount required while ensuring that the public debt amount can be repaid and meets the minimum DSCR requirement. The optimized subsidy amount exactly meets the minimum DSCR requirement. A lower subsidy would cause the minimum DSCR requirement to be breached. A higher subsidy would not make full use of the project's debt capacity and therefore would be inefficient.
To optimize the model after all inputs have been entered and reviewed, the user can simply click on the Optimizer button, which is included on all worksheets in the model. Once the model is optimized (which can take up to a couple of minutes), a brief P3 financing summary is displayed, showing the key financing results and providing guidance on how to potentially further improve the financing solution (see the screenshot on the right).
The P3-VALUE 2.2 tool uses color coding (in sheet tab names, fonts, and shading) to help the user distinguish between inputs, calculations, and outputs. The tables below present the different color coding used in the model.
| Light Yellow | Input sheets |
| No color (default Excel tab color) | Calculation and documentation sheets |
| Pale Blue | Key output sheets |
| Turquoise | Quality control sheets |
| Font color only | |
| Blue font | Imported from another sheet |
| Red font | Exported to another sheet (except from Input sheets) |
| Black font | Within-sheet link or calculation |
| Font + shade combinations | |
| Black font + Light Yellow shade | Project specific inputs (inputs required by user) |
| Black font + Light Orange shade | Non-project specific inputs (default values may be used) |
| Black font + Light Grey shade on entire row | Within-worksheet counter-flow 4 |
| Blue font + Light Grey shade on entire row | Between-worksheet counter-flow |
| Empty Cell with Light Grey shade | Empty cells being deliberately referenced |
| Other | |
| White font + Dark Blue shade on entire row | Section separator |
| Light Turquoise shade | Stored/hard-coded outputs |
| Tan shade | Pre-model time line actuals |
| Error checks & alerts | |
| Green shade | OK |
| Red shade | Error |
| Gold shade | Alert |
The Key sheet also contains a list of abbreviations, name ranges, and Excel functions used in the model.
The model contains an auto-auditing feature to ensure that critical calculations within the model are carried out correctly. For example, if the funding and financing requirement does not match the available funding and financing amounts, the model automatically informs the user through the error checks and alerts the user that something is wrong. The error checks and alerts are visible in each input and calculation sheet. The following shows sample error checks and alerts.
| - | Error checks |
| 4 | Alerts |
If an error check or an alert flag appears at the top of the input and calculation sheets, the user should navigate to the Checks sheet to determine what the cause of the error or alert may be. Error checks are critical and require immediate attention. If the model is functioning correctly, no error checks are to be expected. Alerts are not critical and are used to inform the user of the occurrence of non-critical events. For example, an alert will be displayed if the target balance for the Debt Service Reserve Account (DSRA) is not met (but all debt payments are still fulfilled on time). Please note that error checks and alerts will appear if the user makes changes to the inputs without optimizing the model. In that case, the user should click on the Optimizer button to initiate the optimization process. Upon completion of the optimization process, all error checks should disappear. Depending on the project's specifics, some alerts may remain.
Users can double click on the relevant error check or alert to be taken to the source of the error or alert. For this function to work, the user needs to enable the "detailed-level view" in the Model Navigator. The following presents the various error checks and alerts in this model.
| PSC - Modeling period check | - | check |
| P3 - Modeling period check | - | check |
| Delayed PSC - Modeling period check | - | check |
| PSC - Financing requirement check | - | check |
| PSC - Debt balance check | - | check |
| PSC - Major maintenance balance check | - | check |
| PSC - DSRA balance - Check | - | check |
| P3 - Funding requirement check | - | check |
| P3 - Debt balance check | - | check |
| P3 - Net cash flow NPV check | - | check |
| P3 - Major maintenance balance check | - | check |
| P3 - DSRA balance check | - | check |
| P3 - Negative cash flow to equity check | - | check |
| P3 - Equity bridge balance check | - | check |
| P3 - Fixed asset balance check | - | check |
| P3 - Major maintenance asset balance check | - | check |
| P3 - Cash flow to equity optimization check | - | check |
| P3 - FinStat - P&L check | - | check |
| P3 - FinStat - CF check | - | check |
| P3 - FinStat - BS check | - | check |
| P3 - FinStat - P&L column vs. row sumtotal check | - | check |
| P3 - FinStat - CF column vs. row sumtotal check | - | check |
| P3 - P&L winding up check | - | check |
| PSC - DSRA target balance vs. DSRA balance alert | - | alert |
| P3 - DSRA target balance vs. DSRA balance alert | - | alert |
| PSC - Negative cash flow alert | 1 | alert |
| P3 (Public) - Negative cash flow in operations period alert | 1 | alert |
| PSC - Periodic minimum DSCR vs. DSCR alert | - | alert |
| P3 - Periodic minimum DSCR vs. DSCR alert | - | alert |
| PSC - Interest capitalization alert | 1 | alert |
| P3 - Interest capitalization alert | 1 | alert |
| No Build - P50 - Traffic capacity breach alert | - | alert |
| ML/TL - P50 - Traffic capacity breach alert | - | alert |
| GPL - P50 - Traffic capacity breach alert | - | alert |
| No Build - 100% of P50 - Traffic capacity breach alert | - | alert |
| ML/TL - 100% of P50 - Traffic capacity breach alert | - | alert |
| GPL - 100% of P50 - Traffic capacity breach alert | - | alert |
2 In the detailed-level view, an additional sheet can be accessed: VfM Graph Data sheet.
3 In the detailed-level view, an additional sheet can be accessed: PDBCA Graph Data sheet.
4 Counter-flow refers to the use of elements that are calculated later in the model, either below the current calculation, or in a sheet to the right of the current calculation sheet. For example, interest calculations require the opening debt balance, whereas the opening debt balance may only be calculated at a later point in the calculation sheet.