


| AP | Availability Payment |
| BCA | Benefit Cost Analysis |
| BS | Balance Sheet |
| CF | Cash Flow |
| CFADS | Cash Flows Available to Debt Service |
| DSCR | Debt Service Coverage Ratio |
| DSRA | Debt Service Reserve Account |
| GPL | General Purpose Lanes |
| IRI | International Roughness Index |
| IRR | Internal Rate of Return |
| ML/TL | Managed Lanes or Tolled Lanes |
| MMRA | Major Maintenance Reserve Account |
| O&M | Operations and Maintenance |
| PDBCA | Project Delivery Benefit-Cost Analysis |
| P&L | Profit & Loss |
| PSC | Public Sector Comparator or Conventional Delivery |
| P3 | Public-Private Partnership |
| V/C | Volume/Capacity Ratio |
| VDF | Volume Delay Function |
| WACC | Weighted Average Cost of Capital |
This chapter discusses the following considerations related to VfM analysis and project financing:
Financing is an important part of project delivery in general but especially for P3 delivery. Across the globe, procuring agencies use various methodologically correct ways to consider financing in a VfM assessment. Some of these approaches do not include financing at all, typically because agencies believe that financing should not be a determining factor in the comparison of delivery models. According to these agencies, the underlying valuation of risks and potential cost efficiencies should be the determining factors. They also believe that including the financing structure can make the analysis overly (and unnecessarily) complex and may turn the VfM assessment into a black box. For these reasons, some agencies alternatively prefer to use a very simple approach to consider financing in the VfM assessment, based on a weighted average cost of financing, instead of a full financing structure.
P3 VALUE 2.0 distinguishes between financing as part of the P3 delivery cash flows on the one hand, and financing under Conventional Delivery on the other hand. Regarding the first, the financing structure and financing conditions form an integral part of the "shadow bid" in the P3 VALUE 2.0 model. That makes the model somewhat more complicated as a full financing structure needs to be modeled, but also has important advantages. The main advantages for including the financing for P3 delivery are listed below:
For Conventional Delivery, there are two considerations regarding the inclusion of financing. First, including financing can lead to unintended distortions of the analysis. Differences between the discount rate used for the calculation of the net present value of Conventional Delivery cash flows and the public financing interest rates for Conventional Delivery can distort the results of the VfM assessment. This can be avoided by not including financing in the Conventional Delivery model. Second, public financing structures tend to be less tailored to the project cash flows, which creates "inefficiencies" from a project perspective. One could argue that these "inefficiencies" need to be taken into account in the VfM assessment, because they are the inherent result of Conventional Delivery, which would be an argument for including financing in the Conventional Delivery. At the same time, excess financing at the project level does not necessarily lead to inefficiencies at the portfolio or government level, which could make it unfair and incorrect to attribute the inefficiencies to the Conventional Delivery. It may therefore be fairer and cleaner to not incorporate financing in the Conventional Delivery model.
In order to address these challenges, the P3-VALUE 2.2 tool allows for a Conventional Delivery analysis solely on the basis of operational cash flows and presents the primary VfM analysis results only on the basis of operational cash flows (see VfM Output Summary sheet). As a result, for example, expected construction costs under P3 delivery can be directly compared with construction costs under Conventional Delivery. At the same time, the P3-VALUE 2.2 tool still offers the option to include financing in the Conventional Delivery model and also presents the Conventional Delivery and P3 debt financing cash flows in a worksheet separate from the primary VfM analysis results, in order to allow the user to better understand the project implications from a financing perspective and facilitate the financial viability assessment. Furthermore, the VfM Simplified Output sheet shows how including financing costs will yield the same VfM outcome as the analysis based purely on operational cash flows.
P3 projects typically have complex financing structures, potentially involving a large number of debt and equity instruments. The P3-VALUE 2.2 tool allows users to develop a variety of financing structures. On the P3 side, the financing/funding structure would typically include equity, debt and public Agency subsidy payments. On the PSC side, the financing/funding structure can include debt and public Agency funding.
For both the PSC and P3, debt service can be structured in two ways:
Under annuity-type debt service, no interest capitalization beyond construction is considered. Furthermore, the model enables users to provide a grace period (number of years after substantial completion) during which only interest is due. The remainder of the tenor will be used to repay the principal. The total debt size under annuity-type debt service is determined by the minimum Debt Service Coverage Ratio (DSCR, an input) and the minimum cash flows available for debt service (CFADS), which typically occur in the early years. An example of an annuity-type debt service is shown in Figure 27 below.
Figure 27: Annuity-type Debt Service
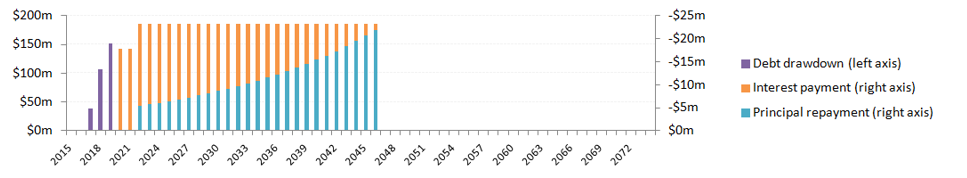
Text description of Figure 27.
This histogram shows the annuity type debt service for a project. The chart shows the debt draw down at the beginning of a project, and then the ratio of interest to principal repayment in inverse ratio (as time progresses interest payments get smaller as principal payments increase). The payments are uniform over the course of the loan.
Under a fully sculpted debt service, the model uses the project's cash flows available for debt service (CFADS) in each year to create a perfectly sculpted repayment profile. This means that the DSCR will be constant throughout the debt service period. Under this approach, the total debt size is determined by the minimum DSCR and the CFADS over the entire debt service period. This may also lead to some interest capitalization during the early years of operation if CFADS in these early years is insufficient to make early interest payments. Although the CFADS under both debt service types are equal, a fully sculpted repayment makes more efficient use of these CFADS by "pushing back" debt service to future periods with higher revenues. As a result, the debt capacity of a fully sculpted debt solution will be larger than the debt capacity of an annuity-type debt solution. Due to the potential interest capitalization in the early years of the concession, the gearing ratio may increase through the end of construction. In the Financing Outputs sheet, the model indicates whether and for how many years interest capitalization is occurring. Furthermore, it provides the maximum outstanding debt as well as the maximum gearing ratio.
Figure 28: Fully Sculpted Debt Service
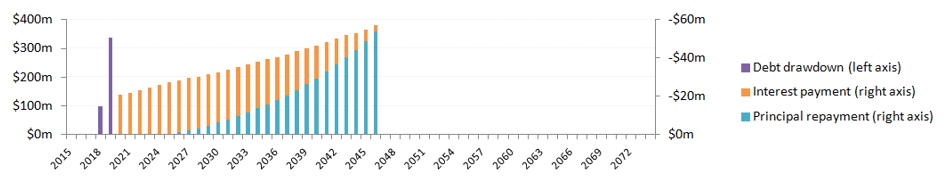
Text description of Figure 28.
This histogram shows fully sculpted debt service for a project, with debt drawn down initially and then a combination of principal and interest payments. As time goes forward, the interest payment decreases in size while the principal repayment increases in size. The net payment increases over time.
In reality, P3 transactions will typically try to create a more or less sculpted debt profile using various debt instruments. The P3-VALUE 2.2 tool gives users the opportunity to analyze the impact of different financing structures.
Under the PSC, agencies can decide to either fund the project (which means it is paid from the Agency's budget) or finance it using debt. In the model, both approaches are possible. If the Agency finances the project, debt will be used to the extent possible (subject to the DSCR requirement) with the remainder funded through subsidies.
Under P3, the concessionaire's financiers will finance all costs and risks transferred to the concessionaire. The costs and risks that are not transferred to the concessionaire (and therefore retained by the Agency) could theoretically be either funded or financed. P3-VALUE 2.2 assumes that all retained costs and risks are directly funded by the Agency.
Many financing structures for P3s in the US include TIFIA loans and/or tax exempt debt. These financing sources include (implicit) subsidies. The financing conditions therefore do not accurately reflect the project's risk profile. The relevant consequences from a state perspective are that:
If the analysis is done from the federal perspective, there are two potential approaches:
To keep things as simple as possible, approach 2 is preferred. P3-VALUE 2.2 allows for both approaches by allowing users to enter the value of any credit subsidy under both Conventional Delivery and P3 delivery.