

Appendix B: Bridge Investment Analysis Methodology
The National Bridge Investment Analysis System (NBIAS) was developed to assess national bridge investment needs and the tradeoff between funding and performance. NBIAS, first introduced in the 1999 C&P Report, is used to model investments in bridge repair, rehabilitation, and functional improvements. Over time, the system has been used increasingly as an essential decision-support tool for analyzing policy and providing information to the U.S. Congress.
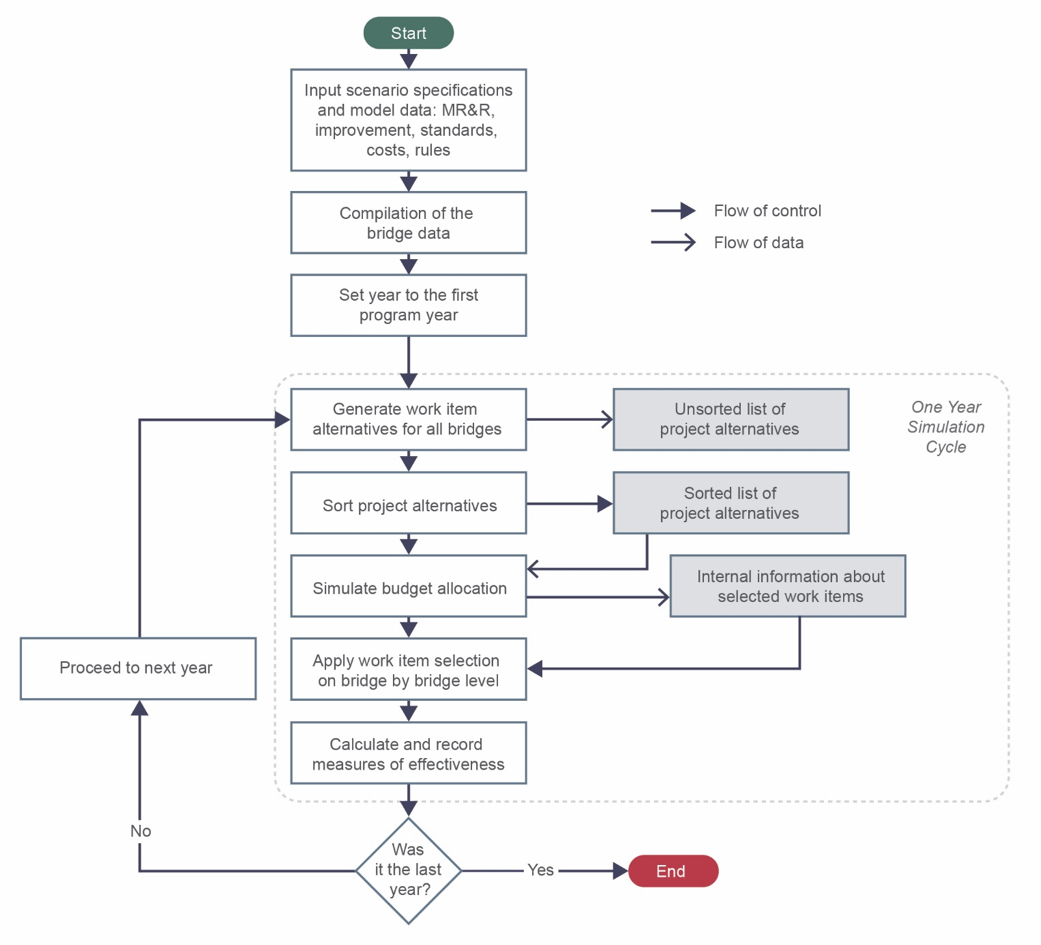
NBIAS is based on an analytical framework similar to that used in the Pontis bridge management system developed by the Federal Highway Administration (FHWA) in 1992 and subsequently adopted by the American Association of State Highway and Transportation Officials (AASHTO). The system incorporates economic forecasting tools to project the multiyear funding needs required to meet user-selected performance objectives over the length of a user-specified performance period. NBIAS differs from Pontis in that it works with bridge condition data as reported by the States, Federal agencies, and Tribal governments for the National Bridge Inventory (NBI) in addition to the element/condition state inspection regime used in Pontis. NBIAS combines statistical models with engineering principles and heuristic rules to synthesize representative elements so they can be defined and manipulated using the same structure of condition states, actions, deterioration, costs, and effectiveness probabilities used in Pontis, which makes them compatible with the predictive models and analytical routines in Pontis. NBIAS extends the Pontis element model by introducing the climate zone dimension into the stratification scheme and adding user cost components to the cost model. Effective in version 4.0 (2011), NBIAS also features an enhanced element optimization model that integrates selected maintenance policies. Exhibit B-1 illustrates the general NBIAS decision-making approach.
Exhibit B-1: NBIAS Flow Chart
General Methodology
Using linear programming optimization, NBIAS generates a set of prototype maintenance policies for defined subsets of the NBI. Models of element deterioration, feasible actions, and the cost and effectiveness of those actions are incorporated as major inputs for each subset of the inventory. For functional deficiencies and improvements, NBIAS uses a model similar to the bridge level-of-service standards and user cost models of Pontis, augmented by a bridge improvement model developed by the Florida Department of Transportation.
With a set of synthesized projects developed from the maintenance and functional improvement models, NBIAS calculates a tradeoff structure showing the effect of hypothetical funding levels on each of more than 200 performance measures, including FHWA’s recently adopted measures of the percentage of bridge deck area in good, fair, and poor condition. For this analysis, the system uses an adaptation of an incremental benefit-cost model with graphical output showing the tradeoff between funding and performance. To estimate functional improvement needs, NBIAS applies a set of improvement standards and costs, which the user can modify, to each bridge in the NBI. The system uses the available NBI data to predict detailed structural element data for each bridge. It measures repair and rehabilitation needs at the bridge-element level using a Markov decision model and then applies the obtained maintenance strategy, along with the improvement model, to each bridge.
Replacement costs for structures are determined based on State-reported values gathered by FHWA. Improvement costs are consistent with those in Pontis and are adjusted to account for inflation. In evaluating functional improvement needs and repair and rehabilitation needs, the system uses a set of unit costs for various improvement and preservation actions. State-specific cost-adjustment factors are applied to the unit costs.
The NBIAS user can specify hypothetical budget constraints in several ways, by setting (1) a range of constant budgets, which directs the software to find the performance levels achievable with each budget level within the range; (2) a range of budget growth rates; or (3) a minimum benefit-cost ratio, in which case, the software determines the funding level corresponding to that benefit-cost ratio. All of these options have applications in the preparation of the C&P Report and could be useful for specific owner agencies that might want to use NBIAS to analyze the funding vs. performance tradeoff for their transportation asset management plans or other planning purposes.
Determining Functional Improvement Needs
The standards for functional improvement address lane width, shoulder width, load rating, and clearances (vertical and horizontal). NBIAS includes a set of standards by functional class, additional standards derived from sufficiency rating calculations, and those standards prescribed by the Florida Department of Transportation models.
The standards used in NBIAS initially were set to be the same as the default standards specified in Pontis, which were established as an early effort to define level-of-service standards for AASHTO. The standards used in the previous editions of the C&P Report were reviewed and compared with design standards in the AASHTO Green Book, and adjustments were made where warranted. A revised set of standards was subsequently added that triggers consideration of a functional improvement whenever a deduction in sufficiency rating occurs due to road width, load rating, or clearances. Adopting the Florida improvement model enabled further fine-tuning of the analysis logic of functional needs.
NBIAS estimates needs for the following types of bridge functional improvements: widening existing bridge lanes, raising bridges to increase vertical clearances, and strengthening bridges to increase load-carrying capacity. Functional improvement needs are determined by applying user-specified standards to the existing bridge inventory, subject to benefit-cost considerations. For example, a need to raise a bridge will be identified if the vertical clearance under the bridge fails to meet the specified standard and if the stream of discounted excess cost of diverting commercial vehicles around the bridge exceeds the cost of improving the bridge.
If functional improvement is infeasible due to the bridge design or impractical because of deteriorated structural condition, a replacement need is generated. Replacement need might also be identified if a user-specified replacement rule is triggered. For example, one or more replacement rules can be introduced in NBIAS based on the threshold values for age, sufficiency rating, and health index.
Because the benefit predicted for a functional improvement increases proportionally with the amount of traffic, whether a functional improvement is justified, and how much benefit is derived from that improvement, greatly depends on predicted traffic. In the current version of NBIAS, traffic predictions are made for each year in an analysis period based on NBI data. NBIAS allows the user to apply either linear or exponential traffic growth projections. Linear growth was selected for this edition of the C&P report, consistent with the assumption used in the Highway Economic Requirements System (HERS). When NBIAS selects a structure for replacement, the cost of the replacement is based on the number of lanes on the existing bridge. The cost of adding lanes to satisfy increased capacity demands is not included in the cost to construct the replacement structure. Additional costs for expanding bridges to meet increased capacity demands are included in the cost to construct a lane mile of highway used in HERS.
Determining Repair and Rehabilitation Needs
To determine repair and rehabilitation needs, NBIAS estimates the type, quantity, and condition of elements that exist for each bridge in the NBI by statistical means and applies a set of deterioration and cost models to the estimated elements. This allows NBIAS to determine the optimal preservation actions for maintaining the bridge inventory in a state of good repair while minimizing user and agency costs.
Predicting Bridge Element Composition
The NBIAS analytical approach relies on structural element data not available in the NBI. To develop such data, NBIAS uses a set of Synthesis, Quantity, and Condition (SQC) models to predict the elements that exist on each bridge in the NBI and the condition of those elements.
The synthesis part of the SQC model is implemented as a decision tree, in which the choice of the elements for a bridge is dictated by its design, material, and several other characteristics available in the NBI. Element quantities are estimated based on the geometric dimensions of the bridge, its design, and material. The condition of the synthesized elements is modeled in the form of a percentage-based distribution of element quantities across condition states. Such distributions are evaluated based on the structural ratings (superstructure, substructure, and deck) of the bridge to which statistically tabulated lookup data and Monte Carlo simulation are applied.
The current version of NBIAS can accept the direct import of structural element data when such data are available, but this capability was not used for the development of this report. States are now required to collect and report such data for bridges on the National Highway System (NHS). Many collect such data for other State-owned bridges, as well, as part of their bridge inspection process.
Calculating Deterioration Rates
NBIAS models bridge deterioration probabilistically, based on techniques first developed for Pontis. In the system, deterioration rates are specified for each bridge element through a set of transition probabilities that specify the likelihood of progression from one condition state to another over time. For each element, deterioration probability rates vary across nine climate zones.
Forming the Optimal Preservation Policy
The policy of maintenance, repair, and rehabilitation (MR&R) in NBIAS is generated with the help of two optimization models: long-term and short-term. The long-term model is formulated as a linear program with the objective of keeping the element population in a steady-state condition that requires the minimum cost to maintain. The short-term model, not being concerned with the steady state, seeks to find a policy of remedial actions that minimize the cost of moving the inventory to conditions the long-term solution recommends. The short-term MR&R model is implemented as the Markov decision model solved as a linear programming problem.
In the earlier versions of NBIAS, only one MR&R strategy was available. While developing NBIAS version 4.0, a study was conducted to develop alternative MR&R models. The result was three additional MR&R strategies reflecting approaches for maintaining a bridge network that are more diverse, as discussed in the following sections.
Minimize MR&R Costs
This strategy involves identifying and implementing a pattern of MR&R improvements that minimizes long-term MR&R spending. This strategy is intended to prevent a catastrophic decrease in bridge network performance rather than to maintain or improve the overall condition of the bridge network. Some Pontis users and participants on expert peer-review panels for NBIAS had raised concerns that this strategy was not consistent with typical bridge management strategies, and that following such a strategy could call for a bridge to be replaced sooner than might be the case if a more aggressive MR&R approach were used.
One consequence of having initially developed this strategy as the only MR&R option in NBIAS was that most measures of bridge performance (such as the health index or percentage of deficient bridges) would always worsen over the 20-year analysis period, even if all the potential bridge improvements identified in NBIAS as cost-beneficial were implemented. The exception was the estimated backlog of bridge needs, which is why this report has focused on that metric in the past. The MR&R strategy influences the estimated backlog; assuming a less aggressive MR&R strategy reduces the estimated MR&R backlog but also increases the estimated bridge replacement backlog, generally resulting in a higher combined backlog estimate.
Maximize Average Returns
This strategy seeks to maximize the degree of bridge system performance improved per dollar of MR&R expenditure. Following this strategy results in more MR&R spending than under the Minimize MR&R strategy, but still generally results in an increase in the number of deficient bridges over time.
Sustain Steady State
This strategy was used for the analyses presented in the 2013 C&P Report. It involves identifying and implementing a pattern of MR&R improvements that would achieve an improved steady state in terms of overall bridge system conditions, without frontloading MR&R investment. Following this strategy results in more MR&R spending than under the Maximize Average Returns strategy, but still generally results in increases in deficient bridges over time.
State of Good Repair
This strategy seeks to bring all bridges to a good condition that can be sustained via ongoing investment. MR&R investment is frontloaded under this strategy, as large MR&R investments would be required in the early years of the forecast period to improve bridge conditions, while smaller MR&R investments would be needed in the later years to sustain bridge conditions.
The selection of MR&R policy can significantly influence the results of an NBIAS analysis. Based on the results of the comparison of life-cycle costs for MR&R relative to replacement, the system might simulate more or fewer bridge replacements. Given the MR&R and replacement costs developed for this C&P Report, the State of Good Repair strategy, although the most aggressive, generates results more consistent with agency practices and recent trends in bridge condition than the other three strategies evaluated. It was used for the 2015 C&P Report and has been adopted for use in the baseline analyses presented in Chapter 7 of this report. (Please note that, despite the similarity in names, the correspondence is not one-to-one between the NBIAS State of Good Repair strategy and the state of good repair benchmark presented in Chapter 7. The state of good repair benchmark includes all investments identified as cost-beneficial by NBIAS and includes both MR&R investments and functional improvements.)
Applying the Preservation Policy
Using transition probability data, and information on preservation action costs and user costs for operating on deteriorated bridge decks, NBIAS applies the Markov decision model to determine the optimal set of repair and rehabilitation actions for each bridge element based on the element's condition. During the simulation process, the preservation policy is applied to each bridge in the NBI to determine bridge preservation work needed to minimize user and agency costs over time.
In analyzing potential improvement options, NBIAS compares the cost of performing preservation work with the cost of completely replacing a bridge, to identify situations in which replacement would be more cost-effective. If the physical condition of the bridge has deteriorated to the point of being considered unsafe (the system user specifies the threshold for such a determination), the system might consider bridge replacement to be the only feasible alternative.
Future NBIAS Enhancements Currently Underway
Several enhancements are being introduced for future versions of NBIAS. One such enhancement is to enable the user to assign individual budgets for specific work categories, such as maintenance, rehabilitation, and replacement of structurally deficient bridges, instead of providing a single budget for all actions. This capability will enable the user to consider a broader array of potential alternative future investment strategies. NBIAS also will be modified to improve its ability to determine budget levels required to meet user-defined performance measures. This feature will enable the user to quickly determine the annual level of funding required over a specified period to change the current value of a performance measure to a user-specified target value.
Another important enhancement is to update the element specifications used in the system. NBIAS was developed using the AASHTO Commonly Recognized Elements specification. This standard was recently superseded by the AASHTO Manual for Bridge Element Inspection. FHWA has incorporated this specification in its requirements for submission for bridge element data for NHS bridges detailed in the Specification for National Bridge Inventory Bridge Elements (SNBIBE), and States are in the process of changing their bridge inspection practices to use the new element specifications. NBIAS is being updated to use data reported according to the SNBIBE, allowing for better incorporation of available State data and to support future use of the system. At the same time, the NBIAS element performance algorithms are being recalibrated to improve the model's prediction of various bridge condition measures. These algorithms, which were last fully recalibrated in 2006, are no longer fully consistent with current bridge management practices.
Currently, data for approximately 125,000 culverts are included in NBI. The NBIAS model does not contain the algorithms needed to conduct a full analysis of culverts because, unlike typical bridges, culverts do not have a deck, superstructure, or substructure. Instead, they are self-contained units located under roadway fill and typically are constructed of concrete or corrugated steel pipes. When multiple pipes or box culverts placed side by side below a public roadway span a total length greater than 20 feet, they are considered structures and are subject to the NBI reporting requirements. Functionality is being added to NBIAS to enable analysis of culvert deterioration, projection of future overall culvert conditions, and estimation of the costs of culvert maintenance and replacement.