

Chapter 5: Safety

Key Takeaways
- DOT’s top priority is to make the U.S. transportation system the safest in the world.
- There has been great progress in reducing overall roadway-related fatalities and injuries during the past two decades despite increases in population and travel. During the past decade alone, highway fatalities have decreased by nearly 25 percent.
- During the last five years, fatalities involving pedestrian and bicyclists have increased nearly 15 percent and, on average, account for almost 17 percent of all traffic fatalities.
- As DOT moves toward the vision of zero deaths and injuries on our Nation’s roadways, improvements in data, better safety analysis tools, and implementation of legislative mandates will be essential.
- FHWA’s Focused Approach to Safety addresses the most critical safety challenges surrounding roadway departures, intersections, and pedestrian/bicyclist-involved crashes, which account for nearly 90 percent of traffic fatalities. Focused Approach thus represents an opportunity to reduce fatalities and serious injuries significantly.
Highway Safety
Safety is the U.S. Department of Transportation’s (DOT's) top priority. Three operating administrations within DOT have specific responsibilities for addressing highway safety:
- The Federal Highway Administration (FHWA) focuses on infrastructure safety design and operations.
- The National Highway Traffic Safety Administration (NHTSA) oversees vehicle safety standards and administers driver behavior programs.
- The Federal Motor Carrier Safety Administration (FMCSA) works to reduce crashes, injuries, and fatalities involving large trucks and buses.
This balance of coordinated efforts, coupled with a comprehensive focus on shared, reliable safety data, enables these three DOT administrations to concentrate on their areas of expertise while working toward the Nation’s safety goals and encourages a more unified endeavor.
This chapter provides data on fatalities and injuries as well as information on FHWA safety programs. FHWA provides technical assistance and expertise to Federal, State, Tribal, and local governments for researching, designing, and implementing safety improvements in roadway infrastructure. FHWA supports improvements in safety elements as part of road and bridge construction and system preservation projects. The Highway Safety Improvement Program (HSIP) is FHWA’s primary infrastructure safety funding program. It uses a performance-driven, strategic approach to achieve significant reductions in fatalities and serious injuries on all public roads for all road users, including pedestrians and bicyclists. The HSIP also helps States improve their roadway safety data. Additionally, the HSIP supports railway-highway grade crossing safety through set-aside funding. Use of HSIP funds is driven by a statewide coordinated plan, developed in cooperation with a broad range of multidisciplinary stakeholders, which provides a comprehensive framework for safety. This data-driven State Strategic Highway Safety Plan (SHSP) defines State safety goals and integrates the four “E’s”—engineering, education, enforcement, and emergency services. The SHSP guides States and their collection of data in the use of HSIP and other funds to resolve safety problems and save lives.
Highway Fatalities and Injuries
Statistics discussed in this section are drawn primarily from the Fatality Analysis Reporting System (FARS). FARS is a nationwide census providing DOT, Congress, and the American public with data regarding fatal motor vehicle traffic crashes. NHTSA, which has a cooperative agreement with States to provide information on fatal crashes, maintains FARS. FARS data are combined with exposure data from other sources to produce fatal crash rates. The most frequently used exposure data are estimates of vehicle miles traveled (VMT) that FHWA collects through the Highway Performance Monitoring System (HPMS). The HPMS is a national-level information system that includes data on the extent, condition, performance, use and operating characteristics of the Nation’s highways.
In addition to FARS, NHTSA estimates injuries nationally through the National Automotive Sampling System (NASS), which is composed of two systems: the General Estimates System and the Crashworthiness Data System. Datasets in these systems provide a statistically based annual estimate of total nonfatal injury crashes. It is important to note that safety statistics in this section, compiled in 2016 using data through 2014, represent a “snapshot in time” during the preparation of this report. As a result, some statistics might not precisely correspond to those in other, more recently compiled data and reports.
In 2014, 5.8 million motor vehicle crashes on our Nation’s roadways were reported to police. The crashes ranged in severity, as shown in Exhibit 5-1. Of those crashes, 30,056 involved at least one fatality. In this same year, approximately 1.5 million crashes resulted in injuries that were not life-threatening, and 4.3 million crashes resulted in damage or harm to property alone. From 2004 to 2014, fatal crashes decreased by 21.8 percent, injury crashes decreased by 15.3 percent, and property-damage-only crashes increased by 3.8 percent.
Exhibit 5-1: Crashes by Severity, 2004–2014
| Year | Crash Severity | Total Crashes | ||||||
|---|---|---|---|---|---|---|---|---|
| Fatal | Injury | Property Damage Only | ||||||
| Number | Percent | Number | Percent | Number | Percent | Number | Percent | |
| 2004 | 38,444 | 0.6 | 1,789,046 | 30.0 | 4,126,283 | 69.3 | 5,953,773 | 100.0 |
| 2005 | 39,252 | 0.7 | 1,753,835 | 29.6 | 4,132,826 | 69.7 | 5,925,913 | 100.0 |
| 2006 | 38,648 | 0.7 | 1,677,165 | 29.3 | 4,007,220 | 70.0 | 5,723,033 | 100.0 |
| 2007 | 37,435 | 0.6 | 1,651,565 | 28.6 | 4,076,939 | 70.7 | 5,765,939 | 100.0 |
| 2008 | 34,172 | 0.6 | 1,573,910 | 28.3 | 3,953,040 | 71.1 | 5,561,122 | 100.0 |
| 2009 | 30,862 | 0.6 | 1,460,500 | 27.7 | 3,782,288 | 71.7 | 5,273,650 | 100.0 |
| 2010 | 30,296 | 0.6 | 1,452,378 | 27.9 | 3,724,801 | 71.5 | 5,207,475 | 100.0 |
| 2011 | 29,867 | 0.6 | 1,426,592 | 27.8 | 3,669,122 | 71.6 | 5,125,581 | 100.0 |
| 2012 | 31,006 | 0.6 | 1,511,184 | 28.0 | 3,860,976 | 71.5 | 5,403,166 | 100.0 |
| 2013 | 30,203 | 0.6 | 1,470,861 | 26.9 | 3,973,629 | 72.6 | 5,474,693 | 100.0 |
| 2014 | 30,056 | 0.5 | 1,515,893 | 26.0 | 4,282,261 | 73.5 | 5,828,210 | 100.0 |
Source: Fatality Analysis Reporting System/National Center for Statistics and Analysis, NHTSA.
Exhibit 5-2 displays trends in motor vehicle fatality counts, fatality rates, injury counts, and injury rates from 1980 to 2014. The motor vehicle fatality count was above 51,000 in 1980 and then dropped to less than 43,000 in 1983. The fatality count declined to less than 40,000 in 1992 for the first time in decades but remained above 40,000 every year from 1993 through 2007. Exhibit 5-2 shows significant declines in fatality counts in recent years. Between 2004 and 2014, there was an overall 23.6-percent reduction in fatalities. During that period, a 1.6-percent increase in fatalities occurred in 2005, and a 4.0-percent increase occurred in 2012. Of note is that the large decline in fatalities from 2004 through 2011 included the timing of the implementation of FHWA’s HSIP and the 2008–2009 economic recession.
In addition to the fatality counts shown in Exhibit 5-2, fatality rates are shown for two different measures of exposure: rates expressed in terms of population and rates in terms of VMT. Fatality rates per 100 million (100M) VMT provide a metric that enables transportation professionals to consider fatalities in terms of the additional exposure associated with driving more miles. The fatality rates per 100,000 population shown in Exhibit 5-2 express exposure in terms of people’s likelihood of being killed in a motor vehicle crash, regardless of the amount of highway travel. Such data are also often stratified to examine in greater depth how different demographic groups, such as male drivers aged 16–20 versus male drivers aged 21–44, experience different fatality rates.
Exhibit 5-2: Summary of Fatality and Injury Rates, 1980–2014
| Year | Fatalities | Resident Population (Thousands) | Fatality Rate per 100,000 Population | Vehicle Miles Travelled (Millions) | Fatality Rate per 100 Million VMT | Injured | Injury Rate per 100,000 Population | Injury Rate per 100 Million VMT |
|---|---|---|---|---|---|---|---|---|
| 1980 | 51,091 | 227,225 | 22.48 | 1,525,104 | 3.35 | |||
| 19821 | 43,945 | 231,664 | 18.97 | 2,496,875 | 1.76 | |||
| 1984 | 44,257 | 235,825 | 18.77 | 1,722,062 | 2.57 | |||
| 1986 | 46,087 | 240,133 | 19.19 | 1,836,135 | 2.51 | |||
| 1988 | 47,087 | 244,499 | 19.26 | 2,029,612 | 2.32 | 3,416,000 | 1,397 | 168 |
| 1990 | 44,599 | 249,439 | 17.88 | 2,144,183 | 2.08 | 3,231,000 | 1,295 | 151 |
| 19922 | 39,250 | 254,995 | 15.39 | 2,242,857 | 1.75 | 3,070,000 | 1,204 | 137 |
| 1994 | 40,716 | 260,327 | 15.64 | 2,353,526 | 1.73 | 3,266,000 | 1,255 | 139 |
| 1996 | 42,065 | 265,229 | 15.86 | 2,482,202 | 1.69 | 3,483,000 | 1,313 | 140 |
| 1998 | 41,501 | 270,248 | 15.36 | 2,628,148 | 1.58 | 3,192,000 | 1,181 | 121 |
| 2000 | 41,945 | 281,422 | 14.90 | 2,749,803 | 1.53 | 3,077,000 | 1,093 | 112 |
| 2002 | 43,005 | 288,369 | 14.91 | 2,855,756 | 1.51 | 2,813,000 | 975 | 99 |
| 2003 | 42,884 | 290,810 | 14.75 | 2,890,893 | 1.48 | 2,776,000 | 955 | 96 |
| 2004 | 42,836 | 293,655 | 14.59 | 2,962,513 | 1.45 | 2,652,000 | 903 | 90 |
| 2005 | 43,510 | 296,410 | 14.68 | 2,989,807 | 1.46 | 2,579,000 | 870 | 86 |
| 2006 | 42,708 | 299,398 | 14.26 | 3,014,116 | 1.42 | 2,453,000 | 819 | 81 |
| 2007 | 41,259 | 301,621 | 13.68 | 3,029,822 | 1.36 | 2,381,000 | 789 | 79 |
| 2008 | 37,423 | 304,060 | 12.31 | 2,973,509 | 1.26 | 2,250,000 | 740 | 76 |
| 2009 | 33,883 | 307,007 | 11.04 | 2,953,501 | 1.15 | 2,117,000 | 690 | 72 |
| 2010 | 32,999 | 308,746 | 10.69 | 2,967,266 | 1.11 | 2,105,000 | 682 | 71 |
| 2011 | 32,479 | 311,592 | 10.42 | 2,950,402 | 1.10 | 2,061,000 | 661 | 70 |
| 2012 | 33,782 | 313,914 | 10.76 | 2,968,815 | 1.14 | 2,157,000 | 687 | 73 |
| 2013 | 32,894 | 316,129 | 10.41 | 2,988,323 | 1.10 | 2,110,000 | 667 | 71 |
| 2014 | 32,744 | 318,857 | 10.27 | 3,025,656 | 1.08 | 2,154,000 | 676 | 71 |
1 Fatalities subsequently dropped to 42,589 in 1983.
2 Fatalities subsequently rose to 40,150 in 1993.
Source: Fatality Analysis Reporting System/National Center for Statistics and Analysis, NHTSA.
Traffic Fatality Trends Since 2014
Although this report focuses primarily on data through 2014, more recent data show that 35,484 people died in crashes on U.S. roadways during 2015, followed by an increase to 37,806 in 2016 and a decline to 37,133 in 2017. The 8.4-percent increase from 2014 to 2015 was the largest annual increase observed since a 9.4-percent increase from 1963 to 1964. The fatality rate per 100 million VMT increased to 1.15 in 2015 and 1.19 in 2016, then dropped to 1.16 in 2017.
The number of vehicle occupant fatalities increased from 22,307 in 2014 to 24,973 in 2017, a 12.0-percent increase. Motorcyclist fatalities increased from 4,594 in 2014 to 5,172 in 2017, which represents a 12.5 percent increase. Pedestrian fatalities increased more sharply to 5,494 in 2015 and 6,080 in 2016 before dropping slightly to 5,977 in 2017, an overall increase of 21.7 percent from 2014 to 2017. Pedalcyclist fatalities increased to 783 in 2017 (a 7.4-percent increase). Non-motorist fatalities overall rose to 6,556 in 2015, then further up to 7,193 in 2016 before declining to 6,988 in 2017; this represents a 19.6 percent increase from 2014 to 2017.
The fatality rate per 100,000 population was 22.48 in 1980. This rate dropped to 17.88 in 1990 and to 14.90 in 2000. Except for 2012, the fatality rate per population steadily decreased from 2004 to 2014. In 2004, the fatality rate per 100,000 population was 14.59; it decreased to 10.27 in 2014, a 29.6 percent reduction over the 10-year period.
The fatality rate, expressed in terms of VMT, was 5.50 deaths per 100M VMT in 1966. That rate fell below 5.00 in 1970 and to less than 4.00 since 1974. Due to significant progress in traffic safety in the United States, the motor vehicle fatality rate has continued to decline. The rate has remained less than 2.00 since 1992. In 2003, the rate dropped below 1.50 and continued to drop from 1.45 in 2004 to 1.08 in 2014, which is the lowest rate on record (Exhibit 5-2).
Every Day Counts Initiative
The overall decline in roadway fatalities over the past several years may be attributable to a variety of factors, including advances in vehicle crash avoidance and occupant protection, demographic and behavioral changes, and highway infrastructure improvements. FHWA-related developments over this time have included an increase in the HSIP spending rate and roadway safety infrastructure improvements such as SafetyEdgeSM, Innovative Intersection and Interchange Geometrics, High Friction Surface Treatments, the use of data and analytical tools, Road Safety Audits, and the collection and sharing of notable practices across the country. The improvements in infrastructure include some of the innovative technologies being deployed as part of FHWA’s Every Day Counts (EDC) initiative.
FHWA launched EDC in cooperation with the American Association of State Highway and Transportation Officials (AASHTO) to expedite the delivery of highway projects and to address the challenges presented by limited budgets. The EDC initiative is a State-based model to identify and rapidly deploy proven but underutilized innovations to shorten the project delivery process, enhance roadway safety, reduce congestion, and improve environmental sustainability. EDC-1 occurred in 2011–2012, followed by EDC-2 in 2013–2014 and EDC-3 in 2015–2016. EDC-4 is planned for 2017–2018.
Also shown in Exhibit 5-2 are the national estimates for people nonfatally injured in motor vehicle crashes. A historic low of 2,061,000 injured was reached in 2011 with an injury rate of 70 per 100M VMT. In 2014, the injury count rose to 2,154,000, and the rate rose slightly to 71 per 100M VMT. Since 2004, the number of people injured in motor vehicle crashes has decreased by 18.8 percent, though there were annual increases in 2012 and 2014 of 4.7 percent and 2.1 percent, respectively.
The trends since 1980 of the fatality counts and fatality rates, as discussed above and shown in Exhibit 5-2, are displayed graphically in Exhibits 5-3 and 5-4. Exhibit 5-3 shows the number of motor vehicle fatalities from 1980 to 2014. Exhibit 5-4 shows the motor vehicle fatality rates per 100M VMT from 1980 to 2014.
Exhibit 5-3: Fatalities, 1980–2014
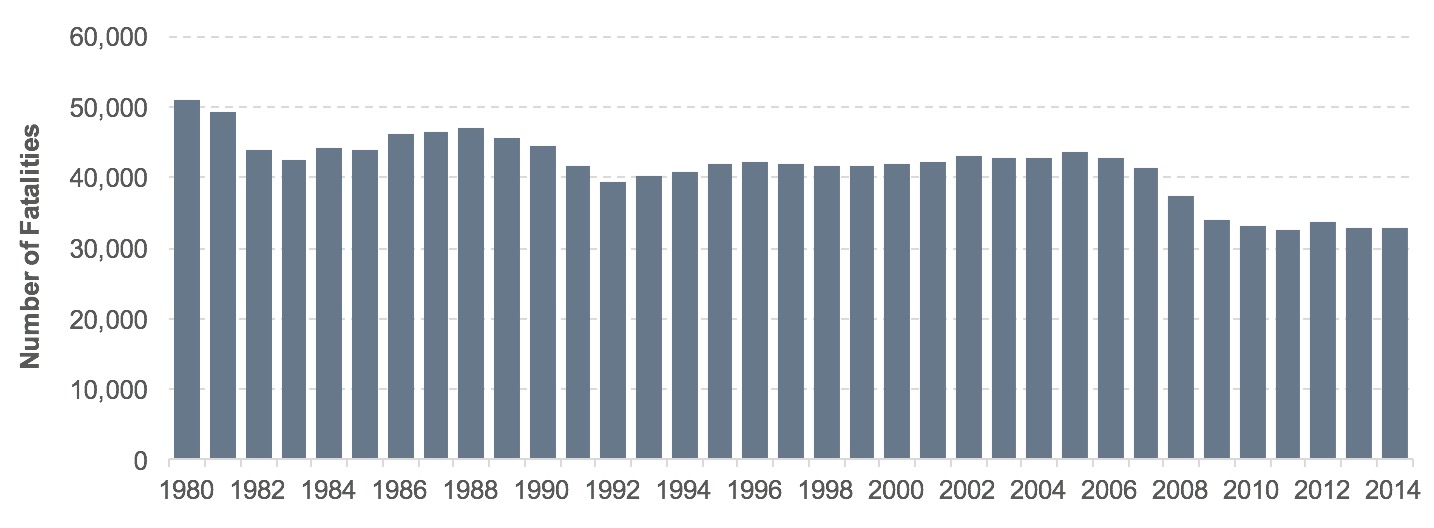
Source: Fatality Analysis Reporting System/National Center for Statistics and Analysis, NHTSA.
Exhibit 5-4: Fatality Rates, 1980–2014
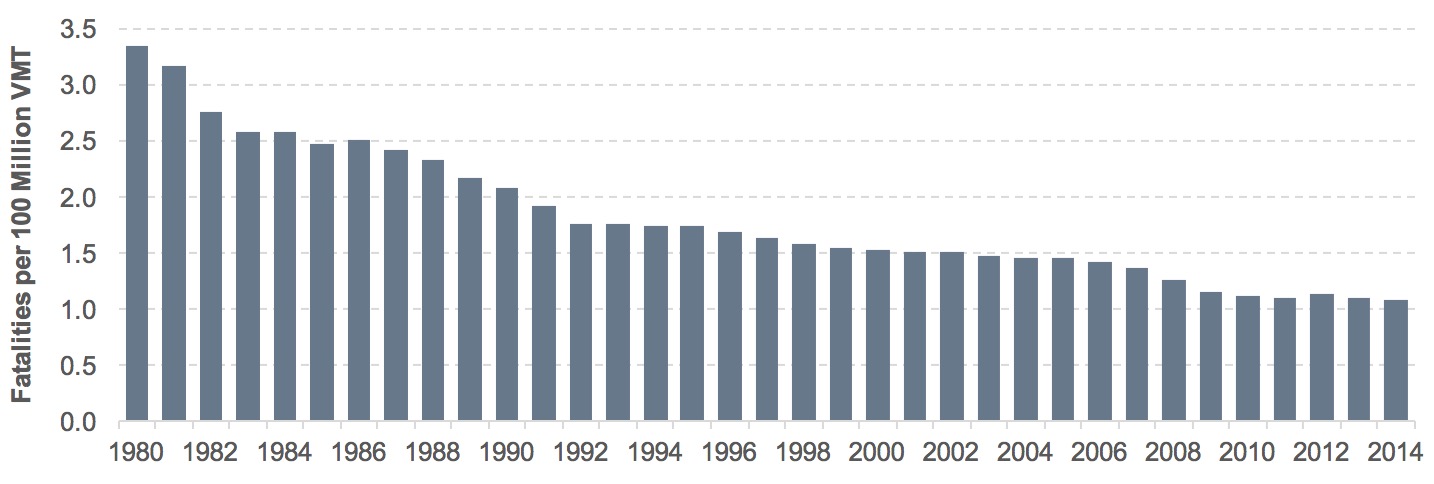
Source: Fatality Analysis Reporting System/National Center for Statistics and Analysis, NHTSA.
Fatalities by Roadway Functional System
The previous section presents overall counts and rates for both fatalities and injuries. This section focuses on how fatality counts and fatality rates differ between rural and urban roadway functional systems. Exhibit 5-5 displays fatality counts and Exhibit 5-6 displays fatality rates for 2004 through 2014.
Exhibit 5-5: Fatalities by Functional System, 2004–2014
| Functional System | 2004 | 2005 | 2006 | 2007 | 2008 | 2009 | 2010 | 2011 | 2012 | 2013 | 2014 | Percent Change 2004 to 2014 |
|---|---|---|---|---|---|---|---|---|---|---|---|---|
| Rural Areas (under 5,000 in population) | ||||||||||||
| Interstate | 3,227 | 3,248 | 2,887 | 2,677 | 2,422 | 2,045 | 2,113 | 1,969 | 1,835 | 1,994 | 1,762 | -45.4% |
| Other Principal Arterial | 5,167 | 4,821 | 4,554 | 4,786 | 4,395 | 4,652 | 3,986 | 4,050 | 4,219 | 4,152 | 4,044 | -21.7% |
| Minor Arterial | 5,043 | 4,483 | 4,346 | 4,186 | 3,507 | 2,957 | 3,015 | 2,989 | 3,482 | 3,258 | 3,316 | -34.2% |
| Major Collector | 5,568 | 5,757 | 5,675 | 5,637 | 5,084 | 4,568 | 4,171 | 4,182 | 4,220 | 3,873 | 3,673 | -34.0% |
| Minor Collector | 1,787 | 1,635 | 1,650 | 1,487 | 1,421 | 1,342 | 1,143 | 989 | 958 | 874 | 829 | -53.6% |
| Local | 4,162 | 4,443 | 4,294 | 4,327 | 4,060 | 3,626 | 3,540 | 3,454 | 3,452 | 3,485 | 3,024 | -27.3% |
| Unknown Rural | 225 | 200 | 240 | 154 | 98 | 133 | 121 | 136 | 201 | 104 | 143 | -36.4% |
| Total Rural | 25,179 | 24,587 | 23,646 | 23,254 | 20,987 | 19,323 | 18,089 | 17,769 | 18,367 | 17,740 | 16,791 | -33.3% |
| Urban Areas (5,000 or more in population) | ||||||||||||
| Interstate | 2,602 | 2,734 | 2,663 | 2,685 | 2,300 | 2,049 | 2,124 | 2,159 | 2,150 | 2,101 | 2,332 | -10.4% |
| Other Freeway and Expressway | 1,673 | 1,735 | 1,690 | 1,497 | 1,538 | 1,321 | 1,232 | 1,277 | 1,150 | 1,061 | 1,125 | -32.8% |
| Other Principal Arterial | 4,847 | 5,364 | 5,447 | 5,021 | 4,504 | 4,005 | 4,294 | 4,142 | 4,538 | 4,605 | 4,951 | 2.1% |
| Minor Arterial | 3,573 | 3,836 | 3,807 | 3,596 | 3,128 | 2,829 | 2,945 | 2,858 | 3,065 | 2,972 | 3,069 | -14.1% |
| Collector | 1,385 | 1,426 | 1,513 | 1,467 | 1,256 | 1,158 | 1,069 | 1,137 | 1,236 | 1, | 1,219 | -12.0% |
| Local | 3,290 | 3,458 | 3,622 | 3,612 | 3,461 | 3,098 | 2,978 | 2,969 | 3,195 | 3,249 | 3,127 | -5.0% |
| Unknown Urban | 211 | 74 | 49 | 30 | 31 | 41 | 17 | 33 | 37 | 17 | 94 | -55.5% |
| Total Urban | 17,581 | 18,627 | 18,791 | 17,908 | 16,218 | 14,501 | 14,659 | 14,575 | 15,371 | 15,119 | 15,917 | -9.5% |
| Unknown Rural or Urban | 76 | 296 | 271 | 97 | 218 | 59 | 251 | 135 | 44 | 35 | 36 | -52.6% |
| Total Fatalities | 42,836 | 43,510 | 42,708 | 41,259 | 37,423 | 33,883 | 32,999 | 32,479 | 33,782 | 32,894 | 32,744 | -23.6% |
Source: Fatality Analysis Reporting System/National Center for Statistics and Analysis, NHTSA.
In 2014, rural roads accounted for 30.4 percent of travel and 51.3 percent of roadway fatalities, whereas urban roads accounted for 69.6 percent of travel and 48.6 percent of roadway fatalities. From 2004 to 2014, the number of fatalities on rural roads decreased from 25,179 to 16,791, resulting in a 33.3-percent reduction. Over the same period, the number of fatalities on urban roads decreased from 17,581 to 15,917, a 9.5-percent reduction.
These declines varied greatly by roadway functional system as shown in Exhibit 5-5. For example, rural interstate fatalities decreased by 45.4 percent from 2004 to 2014, whereas those on rural principal arterials decreased by 21.7 percent. In urban areas, interstate fatalities decreased by 10.4 percent, whereas those on urban freeways and expressways decreased by 32.8 percent and those on urban principal arterials increased by 2.1 percent during the same period.
Similar to the overall fatality numbers, fatality rates trended downward during the same period. Exhibit 5-6 shows the fatality rates per 100M VMT for rural and urban functional systems between 2004 and 2014. During that time, the fatality rate in rural areas declined by 22.6 percent, and, in urban areas, the fatality rate declined by 18.3 percent. Among urban roads, urban Interstate highways were the safest functional system, with a fatality rate of 0.45 in 2014, whereas urban principal arterials and urban local roads had the highest fatality rate of 1.06. Among rural roads, Interstates had the lowest fatality rate of 0.76, whereas local roads had the highest fatality rate of 2.40. Since 2004, rural minor collectors had the largest decline with a 43.8-percent reduction followed by urban freeways and expressways with a 38.2-percent reduction.
Locally Owned Road Safety
More than 30,000 local agencies own and operate 75 percent of the Nation’s roadways. Agency practitioners have varying levels of transportation safety expertise and often perform several duties in addition to those related to transportation safety. FHWA developed Road Safety 365: A Workshop for Local Governments, to help local practitioners routinely identify safety issues along their roadways and provide ideas on how to address them.
Exhibit 5-6: Fatality Rates by Functional System, 2004–2014
| Functional System | 2004 | 2006 | 2008 | 2009 | 2010 | 2012 | 2014 | Percent Change 2004 to 2014 |
|---|---|---|---|---|---|---|---|---|
| Rural Areas (under 5,000 in population) | ||||||||
| Interstate | 1.21 | 1.12 | 1.00 | 0.85 | 0.86 | 0.75 | 0.76 | -37.1% |
| Other Principal Arterial | 2.14 | 1.96 | 1.98 | 2.10 | 1.77 | 1.89 | 1.88 | -11.9% |
| Minor Arterial | 2.99 | 2.67 | 2.31 | 1.96 | 2.00 | 2.34 | 2.36 | -21.1% |
| Major Collector | 2.77 | 2.94 | 2.73 | 2.58 | 2.37 | 2.40 | 2.31 | -16.6% |
| Minor Collector | 2.97 | 2.84 | 2.58 | 2.49 | 2.14 | 1.81 | 1.67 | -43.8% |
| Local | 3.14 | 3.22 | 3.08 | 2.68 | 2.67 | 2.65 | 2.40 | -23.4% |
| Total Rural | 2.35 | 2.28 | 2.12 | 1.97 | 1.84 | 1.88 | 1.82 | -22.6% |
| Urban Areas (5,000 or more in population) | ||||||||
| Interstate | 0.57 | 0.56 | 0.48 | 0.43 | 0.44 | 0.44 | 0.45 | -21.3% |
| Other Freeway and Expressway | 0.80 | 0.78 | 0.69 | 0.60 | 0.56 | 0.51 | 0.49 | -38.2% |
| Other Principal Arterial | 1.08 | 1.17 | 0.97 | 0.88 | 0.94 | 0.99 | 1.06 | -2.0% |
| Minor Arterial | 0.99 | 1.01 | 0.83 | 0.75 | 0.79 | 0.83 | 0.79 | -20.5% |
| Collector | 0.85 | 0.87 | 0.72 | 0.65 | 0.59 | 0.69 | 0.59 | -30.1% |
| Local | 1.29 | 1.36 | 1.28 | 1.16 | 1.09 | 1.16 | 1.06 | -17.8% |
| Total Urban | 0.93 | 0.95 | 0.82 | 0.73 | 0.74 | 0.77 | 0.76 | -18.3% |
| Total Fatality Rate | 1.45 | 1.42 | 1.26 | 1.15 | 1.11 | 1.14 | 1.08 | -25.5% |
Source: Fatality Analysis Reporting System/National Center for Statistics and Analysis, NHTSA.
Despite the overall decreases in fatality rates on both urban and rural functional systems, with the exception of 2012, rural roads remained far more dangerous than urban roads, evidenced by a fatality rate that was 2.39 times higher (1.82 per 100M VMT on rural roads compared to 0.76 on urban roads). In 2014, the fatality rate on rural local roads was 2.27 times higher than that of urban local roads (2.40 per 100M VMT compared to 1.06). Several factors collectively comprise the safety challenges on rural roads, including the roadway, behavioral factors, and emergency services issues. Addressing the challenges associated with non-Interstate roads can be made more difficult by the diversity of ownership: States maintain Interstate roads, whereas other roads are maintained by either the State or a variety of local organizations, including cities and counties.
Vision: Toward Zero Deaths and Serious Injuries on the Nation’s Roadways
The DOT strategic goal on safety is “Reduce transportation-related fatalities and serious injuries across the transportation system.” To help accomplish this goal, FHWA oversees the HSIP, a core Federal-aid program, the goal of which is to achieve a significant reduction in traffic fatalities and serious injuries on all public roads, including non-State-owned public roads and roads on Tribal lands. The HSIP requires a data-driven, strategic approach to improving highway safety on all public roads that focuses on performance. By improving data and promoting analysis and evaluation, implementing programs based on current highway safety knowledge, and conducting research to expand that knowledge base, FHWA continues to move toward zero deaths on the Nation’s roadways.
FHWA coordinates with States as they develop SHSPs. As a major component and requirement of the HSIP, an SHSP is a statewide coordinated safety plan, developed by a State department of transportation in cooperation with a broad range of safety stakeholders. An SHSP analyzes highway safety problems, identifies a State’s key safety needs, and guides decisions toward strategies and investments with the most potential to save lives and prevent injuries. The SHSP enables highway safety programs and partners in the State to work together to align goals, leverage resources, and collectively address the State’s safety challenges. FHWA requires SHSPs to be updated every five years to ensure States use current data for problem identification and evidence-based strategies that have the most potential to save lives and prevent injuries.
To support their SHSPs, States must have a safety data system to identify problems and analyze countermeasures on all public roads; adopt strategic and performance-based goals; advance data collection, data analysis, and data integration capabilities; determine priorities for correcting the identified safety problems; and establish evaluation procedures.
Road to Zero
FHWA, NHTSA, and FMCSA are working with the National Safety Council (NSC) on a national road safety leadership initiative titled Road to Zero (RTZ). This initiative involves a national coalition of organizations and individuals with a commitment to eliminating road deaths within the next 30 years. RTZ is focusing on both short-term activities, including funding for innovative safety activities, and on a long-term vision for zero traffic fatalities. Activities are guided by a steering committee made up of 11 organizations representing the vehicle, the driver, and the roadway. Operational leadership is provided by NSC and FHWA, while NHTSA and FMCSA provide an advisory and supportive role.
Improved Data
FHWA promotes improved data, analysis methods, and evaluation capabilities, that collectively make a major contribution toward advancements in highway safety. Better data and enhanced ways to analyze the data produce valuable information for local, State, national, and private transportation safety stakeholders. These improvements also help members of the highway safety community reduce traffic fatalities, injuries, and property-damage-only crashes.
The FHWA Roadway Safety Data Program works to develop, evaluate, and deploy life-saving countermeasures; advances the use of scientific methods and data-driven decisions; and promotes an integrated, multidisciplinary approach to safety. The program helps improve safety data and expand capabilities for analysis and evaluation. The effectiveness of safety programs is directly linked to the availability and analysis of reliable crash and roadway data.
During 2012, FHWA completed a roadway safety data capabilities assessment in each State. The assessment identified opportunities for improvement that the Roadway Safety Data Program has since addressed through development of guidance and informational resources and the delivery of technical assistance, webinars, and peer exchanges. FHWA is conducting another roadway safety data capabilities assessment in each State during 2017–2018. This assessment will be useful to States as they implement and achieve performance goals.
Improved Safety Analysis Tools
FHWA provides and supports a wide range of data and safety analysis tools for State and local highway agency practitioners. These tools help practitioners understand safety problems on their roadways, link crashes to their roadway environments, and select and apply appropriate countermeasures. The tools’ capabilities range from simple to complex. Some provide general information; others enable complex analysis of crashes under specific conditions or with specific roadway features.
One valuable safety analysis tool is the Highway Safety Manual (HSM), published by AASHTO and developed through cooperative research initiated by FHWA. The document’s primary focus is the introduction and development of analytical tools for predicting the impact of transportation project and program decisions on road safety. The HSM provides improved information and tools that facilitate roadway planning, design, operations, and maintenance decisions based on precise consideration of their safety consequences.
To support use of HSM methods, FHWA has delivered training, developed informational resources, and offered technical assistance for States and local highway agency practitioners. In addition, cooperative research initiated by FHWA has developed safety analysis tools, including the Interactive Highway Safety Design Model, the Systemic Safety Project Selection Tool, and the Crash Modification Factors Clearinghouse. These tools greatly advance the abilities of State and local highway agencies to incorporate explicit, quantitative consideration of safety into their planning and project development decision-making.
Legislative Mandates
The Moving Ahead for Progress in the 21st Century Act (MAP-21) reauthorizing legislation identified the need for improved and more robust safety data for better safety analysis to support the development of States’ HSIPs and SHSPs. MAP-21 built on and refined many of the highway, transit, bicycle, and pedestrian programs and policies FHWA administers.
MAP-21 supports DOT’s safety initiative: it continued the successful HSIP, doubling funding for infrastructure safety and strengthening the linkage among safety programs at FHWA, NHTSA, and FMCSA. It also continued to build on other aggressive safety efforts, including the Department’s fight against distracted driving and its push to improve transit and motor carrier safety.
The Fixing America’s Surface Transportation (FAST) Act (Pub. L. No. 114-94) was enacted into law on December 4, 2015—the first Federal law in over a decade to provide long-term funding certainty for surface transportation infrastructure planning and investment. The FAST Act maintains FHWA's focus on safety, keeps intact the established structure of FHWA’s various highway-related programs, continues efforts to streamline project delivery and, for the first time, provides a dedicated source of Federal funds for freight projects. With the enactment of the FAST Act, States and local governments are now moving forward with critical transportation projects with the confidence that they will have a Federal partner over the long term.
In 2016, FHWA published the HSIP and Safety Performance Management Measures (Safety PM) Final Rules in the Federal Register. The HSIP Final Rule updates the existing HSIP requirements under Title 23 of the Code of Federal Regulations (CFR) Part 924 to be consistent with the MAP-21 Act and the FAST Act and to clarify existing program requirements. Specifically, the HSIP Final Rule contains three major policy changes related to: (1) HSIP report content and schedule; (2) the SHSP update cycle; and (3) the subset of the Model Inventory of Roadway Elements (MIRE), also known as the MIRE fundamental data elements. Transportation Performance Management rulemakings are discussed more broadly in the Introduction to Part I.
The Safety PM Final Rule adds Part 490 to Title 23 of the CFR to implement the performance management requirements of 23 U.S.C. (United States Code) §150, including the specific safety performance measure requirements for the purpose of carrying out the HSIP to assess serious injuries and fatalities on all public roads. The Safety PM Final Rule establishes five performance measures as the 5-year rolling averages for: (1) Number of Fatalities, (2) Rate of Fatalities per 100 million VMT, (3) Number of Serious Injuries, (4) Rate of Serious Injuries per 100 million VMT, and (5) Number of Nonmotorized Fatalities and Nonmotorized Serious Injuries. The Safety PM Final Rule also establishes the process for State departments of transportation and metropolitan planning organizations (MPOs) to establish and report their safety targets and the process that FHWA will use to assess whether State departments of transportation have met or made significant progress toward meeting their safety targets. In addition, the Safety PM Final Rule also establishes a common national definition for serious injuries.
Together, these regulations will improve data, foster transparency and accountability, and allow safety progress to be tracked at the national level. They will inform State department of transportation and MPO planning, programming, and decision-making for the greatest possible reduction in fatalities and serious injuries.
Focused Approach to Safety
When a crash occurs, it is generally the result of many contributing factors. The roadway, vehicle, and road users are all factors that have an impact on the safety of the Nation’s highway system. FHWA collaborates with other agencies to understand more clearly the relationship among all contributing factors, and to address crosscutting ones, but focuses on infrastructure design and operation to address roadway factors.
In 2014, FHWA examined crash data to identify the most common crash types relating to roadway characteristics. The FHWA established three focus areas to address these factors: roadway departures, intersections, and pedestrian/bicyclist-involved crashes. These three areas were selected because they account for nearly 90 percent of traffic fatalities and represent an opportunity to significantly reduce the number of fatalities and serious injuries. FHWA manages the Focused Approach to Safety program to address the most critical safety challenges surrounding these crashes. Through this program, FHWA focuses its technical assistance and resources on States and cities with high fatality counts and fatality rates in one or more of these three categories.
In 2014, roadway departure, intersection, and pedestrian/bicyclist-involved fatalities accounted for 54.4 percent, 26.5 percent, and 17.8 percent, respectively, of the 32,744 fatalities. Note that these three categories overlap. For example, when a roadway departure crash includes a pedestrian fatality, that crash would be accounted for in both the roadway departure and the pedestrian-related crash categories below. Exhibit 5-7 shows how the number of fatalities for these crash types has changed between 2004 and 2014. During this period, roadway departure fatalities decreased by 26.7 percent, intersection-related fatalities decreased by 21.5 percent, and pedestrian/bicyclist-involved fatalities increased by 5.0 percent.
Because a combination of factors can influence the fatalities shown in Exhibit 5-7, FHWA has developed targeted programs that include collaborative and comprehensive efforts to address all three areas. The Focused Approach to Safety works to address the most critical safety challenges by devoting additional effort to high-priority States and targeting technical assistance and resources. More information is available at (http://safety.fhwa.dot.gov/fas/).
Exhibit 5-7: Fatalities by Crash Type, 2004–2014
| Crash Type | 2004 | 2005 | 2006 | 2007 | 2008 | 2009 | 2010 | 2011 | 2012 | 2013 | 2014 | Percent Change 2004 to 2014 |
|---|---|---|---|---|---|---|---|---|---|---|---|---|
| Roadway Departures1,2 | 23,702 | 24,311 | 23,996 | 23,598 | 21,239 | 19,378 | 18,850 | 18,273 | 18,963 | 18,311 | 17,818 | -24.8% |
| Intersection-Related1,2 | 10,471 | 10,606 | 10,213 | 9,885 | 8,956 | 8,316 | 8,636 | 8,317 | 8,851 | 8,677 | 8,692 | -17.0% |
| Pedestrian/ Bicycle-Related1,2 |
5,509 | 5,803 | 5,722 | 5,516 | 5,273 | 4,863 | 5,075 | 5,284 | 5,741 | 5,692 | 5,814 | 5.5% |
1 Some fatalities may overlap; for example, some intersection-related fatalities may involve pedestrians.
2 Crash types use the 2014 Focus Approach to Safety definitions.
Source: Fatality Analysis Reporting System/National Center for Statistics and Analysis, NHTSA.
Roadway Departures
In 2014, the number of roadway departure fatalities was 17,818, which accounted for 54.4 percent of all traffic fatalities. From 2004 to 2014, roadway departure fatalities decreased by 24.8 percent. A roadway departure crash is defined as a nonintersection crash that occurs after a vehicle crosses an edge line or a center line, or otherwise leaves the traveled way. In some cases, a vehicle crosses the center line and strikes another vehicle, hitting it head-on or sideswiping it. In other cases, the vehicle leaves the roadway and strikes one or more constructed or natural objects, such as utility poles, embankments, guardrails, trees, or parked vehicles.
Roadway Departure Focus States and Countermeasures
Roadway Departure Focus States are eligible for additional resources and assistance. These States are selected based on an assessment of roadway departure fatalities over a 3-year period compared with expected roadway departure fatalities. The current list of Roadway Departure States includes Alabama, Arizona, Florida, Hawaii, Kentucky, Louisiana, Mississippi, South Carolina, Tennessee, Texas, and West Virginia. FHWA offers technical assistance to these States in the form of crash data analysis and implementation plan development.
Many States have developed Roadway Departure Implementation Plans, which are designed to address State-specific safety issues related to roadway departures on both State and local roadways—to the extent that relevant crash data can be obtained and are appropriate based on consultation with State and local agencies and the FHWA Division Office. The plans identify cost-effective countermeasures, deployment levels, and funding needs to reduce the number and severity of roadway departure crashes in the State by a targeted amount consistent with SHSP goals. Each plan quantifies the costs and benefits of a roadway departure-focused initiative and provides an approach for implementation. FHWA also provides outreach to these States through webinars, technical support, and training courses.
Three proven safety countermeasures for reducing roadway departure crashes are:
- Longitudinal rumble strips and stripes on two-lane rural roads: Milled or raised elements on the pavement intended to alert inattentive drivers through vibration and sound that their vehicles have left the travel lane;
- Enhanced delineation and friction for horizontal curves: Signs and pavement deployed to warn the driver in advance of the curve, with pavement friction to reduce skidding due to excessive approach speed into the curve to keep the vehicle in their lane; and
- SafetyEdgeSM: Technology that shapes the edge of a paved roadway in a way that eliminates tire scrubbing, a phenomenon that contributes to losing control of a vehicle.
Intersections
Estimates indicate that the United States has more than 3 million intersections, most of which are nonsignalized (controlled by stop or yield signs), and a small proportion of which are signalized (controlled by traffic signals). Intersections are planned points of conflict in any roadway system. People—some in motor vehicles, others walking or biking—cross paths as they travel through, or turn from, one route to another. Areas where different paths separate, cross, or join are known as conflict points, and these are always present in intersections.
In 2014, 26.5 percent of fatalities were related to intersections, with 36.7 percent occurring in rural areas and 63.3 percent occurring in urban areas, as shown in Exhibit 5-8. From 2004 to 2014, intersection-related fatalities decreased by 17.0 percent. The geometric design of an intersection and corresponding application of traffic control devices can substantially reduce the likelihood of crashes, resulting in fewer crashes, injuries, and fatalities. Furthermore, when the speed of motor vehicles through intersections can be reduced, the severity of crashes that do occur will also be lessened.
Exhibit 5-8: Intersection-Related Fatalities by Functional System, 2014
| Fatalities | ||
|---|---|---|
| Count | Percent of Total | |
| Rural Areas (under 5,000 in population) | ||
| Principal Arterials | 1,049 | 12.2% |
| Minor Arterials | 714 | 8.3% |
| Collectors (Major and Minor) | 852 | 9.9% |
| Locals | 550 | 6.4% |
| Total Rural Areas | 3,165 | 36.7% |
| Urban Areas (5,000 or more in population) | ||
| Principal Arterials | 2,476 | 28.7% |
| Minor Arterials | 1,349 | 15.7% |
| Collectors (Major and Minor) | 423 | 4.9% |
| Locals | 1,204 | 14.0% |
| Total Urban Areas | 5,452 | 63.3% |
| Total Fatalities1 | 8,617 | 100.0% |
1 Total excludes 75 intersection-related fatalities not identified by functional class.
Source: Fatality Analysis Reporting System/National Center for Statistics and Analysis, NHTSA.
Intersection Focus States and Countermeasures
Intersection Focus States are eligible for additional resources and assistance based on an assessment of intersection fatalities over a 3-year period compared with expected fatalities. The current list of Intersection Focus States includes Arizona, Florida, Louisiana, Nevada, New Jersey, New York, South Carolina, Tennessee, and Texas..
As part of the Focused Approach to Safety, FHWA works with States to advance their SHSP strategies for intersection safety. These efforts include pursuing systemic intersection safety improvements, advancing innovative intersection designs (such as roundabouts, J-turns, and diverging diamond interchanges), and encouraging the development of intersection control evaluation policies and procedures. FHWA also assists these States on timely intersection safety matters through webinars, technical support, and training courses.
Five proven countermeasures associated specifically with intersection safety are:
- Roundabouts: A modern circular intersection defined by a set of specific operational principles; designed to create a low-speed environment, high operational performance, and a reduction of conflict points;
- Corridor access management: A set of techniques useful for managing access to highways, major arterials, and other roadways, and that result in reduced crashes, fewer vehicle conflicts, and improved movement of traffic; and
- Backplates with retroreflective border: A device added to traffic signal indications to improve the conspicuity and visibility of the illuminated face of the signal.
- Pedestrian hybrid beacons: Pedestrian-activated warning device located on the roadside or on mast arms over midblock pedestrian crossings; and
- Road diets: A roadway reconfiguration that involves converting an undivided four-lane roadway into three lanes comprising two through-lanes and a center two-way left turn lane.
Pedestrians, Bicyclists, and Other Nonmotorists
The term nonmotorist is defined to be those transportation system users who are not in, or on, traditional motor vehicles on public roadways. This includes persons traveling by foot, children in strollers, skateboarders (including motorized), roller skaters, persons on scooters, persons in wagons, persons in wheelchairs (both nonmotorized and motorized), persons riding bicycles or other pedalcycles (including those with a low-powered electric motor weighing under 100 pounds, with a top motor-powered speed not in excess of 20 miles per hour), persons in motorized toy cars, and persons on two-wheeled, self-balancing types of devices. In 2014, 17.8 percent of the fatalities were nonmotorists. Exhibit 5-9 shows that in 2014, 4,925 pedestrians, 725 bicyclists, and 164 other nonmotorists were killed, totaling 5,814 nonmotorists fatalities.
Since 2004, nonmotorist fatalities have risen by 5.5 percent. From 2006 to 2009, fatalities showed a steady decline of 15.0 percent, but beginning in 2009 that trend began to shift and resulted in a 19.6-percent increase, with a slight decrease of 0.9 percent occurring in 2013. Pedestrian fatalities rose from 4,120 in 2009 to 4,925 in 2014. Bicyclist fatalities rose from 630 in 2009 to 725 in 2014.
Exhibit 5-9: Pedestrian, Bicyclist, and Other Nonmotorist Traffic Fatalities, 2004–2014
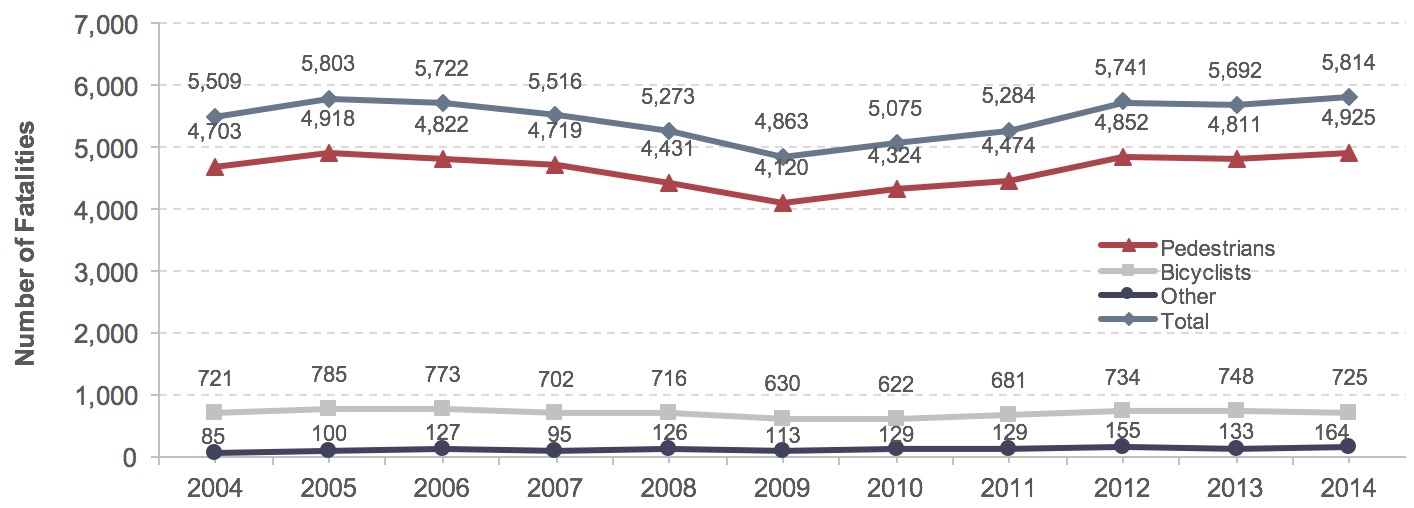
Source: Fatality Analysis Reporting System/National Center for Statistics and Analysis, NHTSA.
In 2016, the Safety PM Final Rule established a new performance measure for the number of nonmotorized fatalities and the number of nonmotorized serious injuries. This combined measure of nonmotorized fatalities and nonmotorized serious injuries will lead to the availability of more data on nonmotorized serious injuries in the future. Additionally, the Safety PM Final Rule established a single, national definition for States to report serious injuries per the Model Minimum Uniform Crash Criteria (MMUCC) 4th Edition attribute for “Suspected Serious Injury (A)” found in the “Injury Status” element. This action will serve to standardize serious injury data to ensure a consistent, coordinated, and comparable serious injury data system that will help stakeholders at the State and national levels address highway safety challenges.
Pedestrian and Bicyclist Safety Focus States and Cities
and Countermeasures
In July 2014, FHWA expanded its pedestrian focus area to include bicyclist and other nonmotorist fatalities. This change was incorporated into the Focused Approach to Safety in 2015.
FHWA designates focus States and focus cities for the pedestrian and bicycle focus area based on the number of pedestrian and bicyclist fatalities or the pedestrian and bicyclist fatality rate per population over a 3-year period.
The Focused Approach to Safety has helped focus States and cities raise awareness of pedestrian and bicyclist safety problems and generate momentum for addressing pedestrian and bicyclist issues. Focused Approach has provided courses, conference calls, web conferences, data analysis, and technical assistance for the development of State and local pedestrian and bicyclist safety action plans.
Focused Approach offers free technical support and training courses to focus States and cities, as well as free bimonthly webinars on a comprehensive, systemic approach to preventing pedestrian and bicyclist crashes. Training is also available at a cost to non-focus States and cities through the Pedestrian and Bicycle Information Center, made possible by the National Highway Institute.
FHWA promotes three proven countermeasures associated specifically with pedestrian safety:
- Median and pedestrian crossing islands in urban and suburban areas: A refuge area in the middle of the roadway, enhancing pedestrian crossing visibility and reducing the speed of vehicles approaching the crossing;
- Pedestrian hybrid beacons: Pedestrian-activated warning device located on the roadside or on mast arms over midblock pedestrian crossings; and
- Road diets: A roadway reconfiguration that involves converting an undivided four-lane roadway into three lanes comprising two through-lanes and a center two-way left turn lane.
Key Takeaways
- The total number of transit fatalities in 2014 (excluding commuter rail) was 236 people, of which 23 were passengers.
- Transit rail fatalities increased by 33% from 2004 to 2014.
- Most rail fatalities in transit are due to collisions. In 2014, 147 people, or 62%, died as a result of collisions, mostly with other vehicles and people.
- Transit rail fatalities occur mostly at transit stations. In 2014, 82 people died at transit stations, or 35% of all transit rail fatalities. These deaths are due primarily to suicides.
- Most bus fatalities occur on roadways, mainly at intersections. In 2014, 74 people died on roadways, or 31% of all fatalities.
- Altogether, rail modes accounted for 57% of non-commuter rail fatalities, and bus accounted for 43%. However, rail accounted for 31% of injuries, whereas bus accounted for 68%.
- There were 23,890 non-commuter rail injuries in 2014. These injuries required medical assistance away from the scenes of the accidents.
- In 2014, 85 people died in commuter rail accidents, a 21% increase from 2004 (70 people). Thus, the total number of fatalities in transit, including commuter rail, increased by 5%, from 306 in 2004 to 321 in 2014.
Transit Safety
This section summarizes national trends in safety and security incidents such as injuries, fatalities, and related performance ratios reported in the National Transit Database (NTD).
NTD compiles safety data for all transit modes, except for commuter rail systems. Those systems are regulated by the Federal Railroad Administration (FRA), which also collects data on their safety performance. This section presents statistics and counts of basic aggregate data such as injuries and fatalities for those systems. For 2014, data were received from 62 rail transit systems, 639 urban fixed-route bus providers, and 372 rural agencies. Reported events occurred on transit property or vehicles, involved transit vehicles, or affected persons using public transportation systems.
Agencies operating 30 or fewer vehicles in peak service are exempted from reporting detailed safety data by mode and victim type. However, these agencies account for a very small share of the national data.
Incidents, Fatalities, and Injuries
A transit agency records an incident for a variety of events occurring on transit property or inside vehicles, involving transit vehicles, or affecting persons using the transit system. Included among these events are any that result in significant property damage, one or more reported injuries, one or more reported fatalities, or some combination thereof. From 2002 to 2007, the definition of significant property damage was total property damage exceeding $7,500 (in current-year dollars, not indexed to inflation); this threshold increased to $25,000 in 2008.
What sort of events result in a recorded transit incident?
A transit agency records an incident for any event occurring on transit property, on board or involving transit vehicles, or to persons using the transit system, that results in one of the following:
- One or more confirmed fatalities within 30 days of the incident;
- One or more injuries requiring immediate transportation away from the scene for medical attention;
- Total property damage to transit property or private property exceeding $25,000;
- Evacuation for life safety reasons;
- Mainline derailment (that is, occurring on a revenue service line, regardless of whether the vehicle was in service or out of service); or
- Fire.
Additionally, a transit agency records an incident whenever certain security situations occur on transit property, such as:
- Robbery, burglary, or theft;
- Rape;
- Arrest or citation, such as for trespassing, vandalism, fare evasion, or assault;
- Cybersecurity incident;
- Hijacking; or
- Nonviolent civil disturbance that disrupts transit service.
Injury and fatality data in NTD are segmented by the types of persons involved in incidents. Passengers are defined as persons traveling, boarding, or alighting a transit vehicle. Patrons are individuals who are in a rail station or at a bus stop but are not necessarily boarding a transit vehicle. Employees are individuals who work for the transit agency, including both staff and contractors. Public includes pedestrians, occupants of other vehicles, and other persons.
Any event for which an injury or fatality is reported is considered an incident. An injury is reported when a person has been transported immediately from the scene for medical care. A transit-related fatality is reported for any death occurring within 30 days of a transit incident that is confirmed to be a result of that incident. These statistics, however, do not include fatalities resulting from medical emergencies on transit vehicles.
An incident is also recorded when property damage exceeds $25,000, regardless of whether the incident resulted in injuries or fatalities.
What types of injuries and fatalities are reported?
Person types are defined as:
- Passengers: Individuals on board a transit vehicle or boarding or alighting a transit vehicle.
- Patrons: Individuals waiting for or leaving transit at stations; in mezzanines; on stairs, escalators, or elevators; in parking lots; or on other transit-controlled property.
- Public: All others who come into contact with the transit system, including pedestrians, automobile drivers, and trespassers.
- Workers: Transit agency employees or contractors engaged in operations or maintenance but not construction of new transit infrastructure.
- Suicides: Individuals who come into contact with the transit system intending to harm themselves.
Exhibit 5-10 shows data on fatalities, both in total fatalities and fatalities per 100 million passenger miles traveled (PMT) for FTA-oversight systems. From 2004 to 2014, the number of fatalities per 100 million PMT remained relatively static, following a significant increase in fatalities between 2011 and 2012, and a peak of 134 fatalities in 2013.
Exhibit 5-10: Annual Transit Fatalities, Including Suicides, 2004–20141
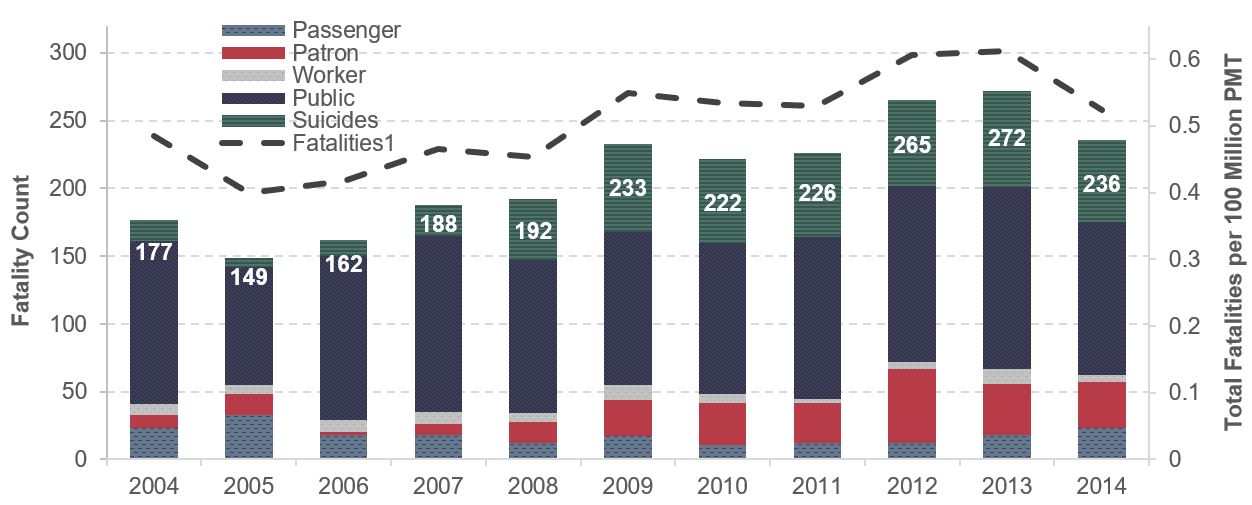
11 Per 100 million PMT Including suicides
Note: Fatality totals include both directly operated (DO) and purchased transportation (PT) service types.
Source: National Transit Database - Transit Safety and Security Statistics and Analysis Reporting.
The interaction between public transit and pedestrians, cyclists, and motorists at rail grade crossings, pedestrian crosswalks, and intersections largely influences overall transit safety performance. Most fatalities and injuries result from interaction with the public on busy city streets, trespassing on transit rights-of-way and facilities, and suicide. Pedestrian fatalities accounted for approximately 24 percent of all transit fatalities in 2014.
Exhibit 5-11 depicts fatalities by event type in 2014. Fatalities in transit are due mostly to collisions and suicides. These two categories accounted for 88 percent of all fatalities in 2014. Collisions are mostly with vehicles at grade crossings. The number of deaths due to homicide accounted for only 8 percent of fatalities, mostly involving nonusers of transit.
Exhibit 5-12 shows fatalities by location type for bus and rail modes. Over 70 percent of bus fatalities occur at roadways, and most victims are the public. In 2013, FTA, in partnership with Operation Lifesaver, made grant funds available to transit and local government agencies to develop safety education and public awareness initiatives for rail transit to ensure that people are safe near trains, tracks, and at crossings. Such awareness is increasingly important for drivers and pedestrians as rail transit expands into new communities across the country. To receive a grant, projects must provide a 25 percent match and focus on safety education or public awareness initiatives in communities with rail transit systems (commuter rail, light rail, and streetcar) using Operation Lifesaver-approved materials.i
Exhibit 5-11: 2014 Transit Fatality Event Types1
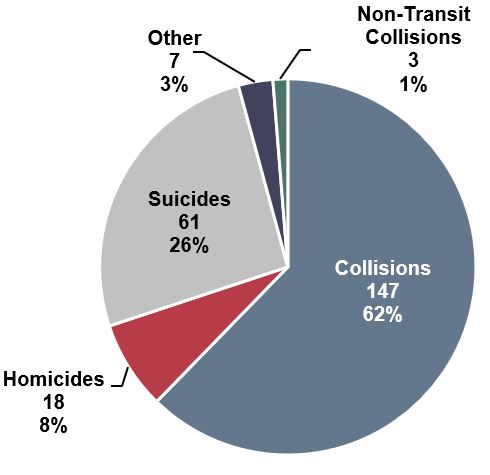
1Exhibit includes data for all transit modes, excluding commuter rail.
Note: Other Event Type includes fatalities due to smoke inhalation, slips & falls, electric shock events, and trespassers with an unknown cause of death.
Source: National Transit Database.
Exhibit 5-12: Location Type of Rail and Bus Fatalities, 2014
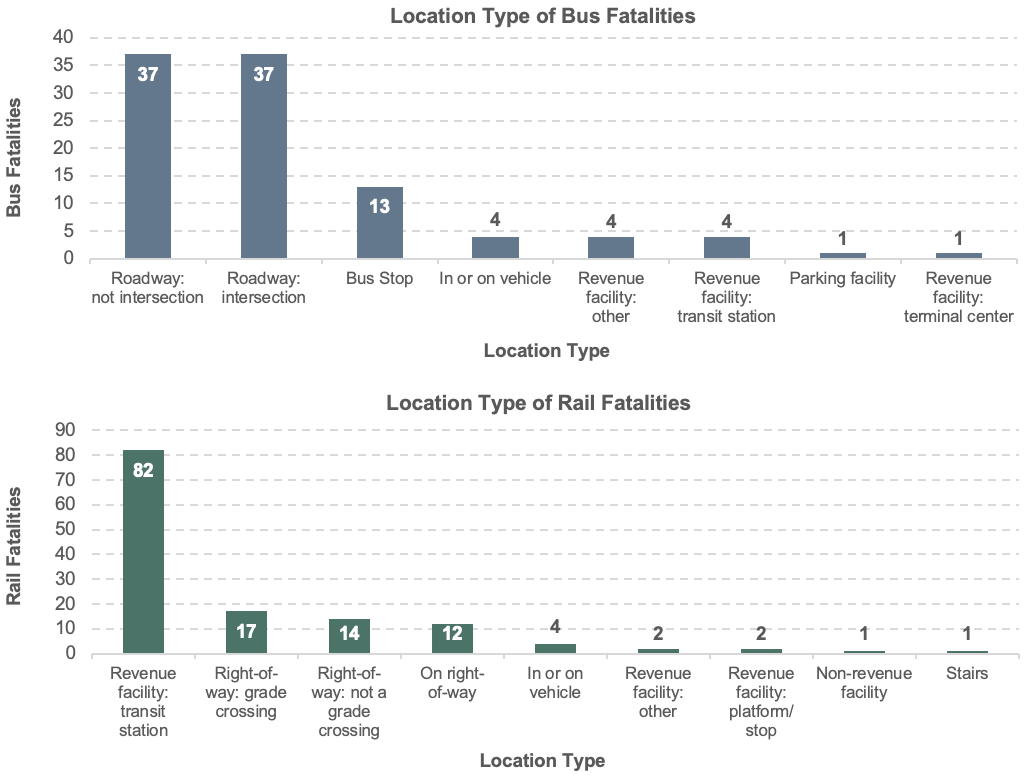
Source: National Transit Database - Transit Safety and Security Statistics and Analysis Reporting.
Exhibit 5-13 depicts the split of fatalities and injuries for rail modes and fixed-route bus. Rail fatalities account for 60 percent of fatalities but include virtually all suicides, which account for a significant share of all transit fatalities as shown in Exhibit 5-11. Rail service includes modes with distinct operating technologies and demand profiles. For example, the most common type of accidents involve people walking along sidewalks by light rail and streetcar systems. Transit passengers account for a small share of fatalities and injuries. On the other hand, other vehicle occupants (in collision accidents) and collisions with pedestrian in crossings account for 50 percent of bus fatalities.
Exhibit 5-13: Transit Fatalities and Injuries by Mode, 2014
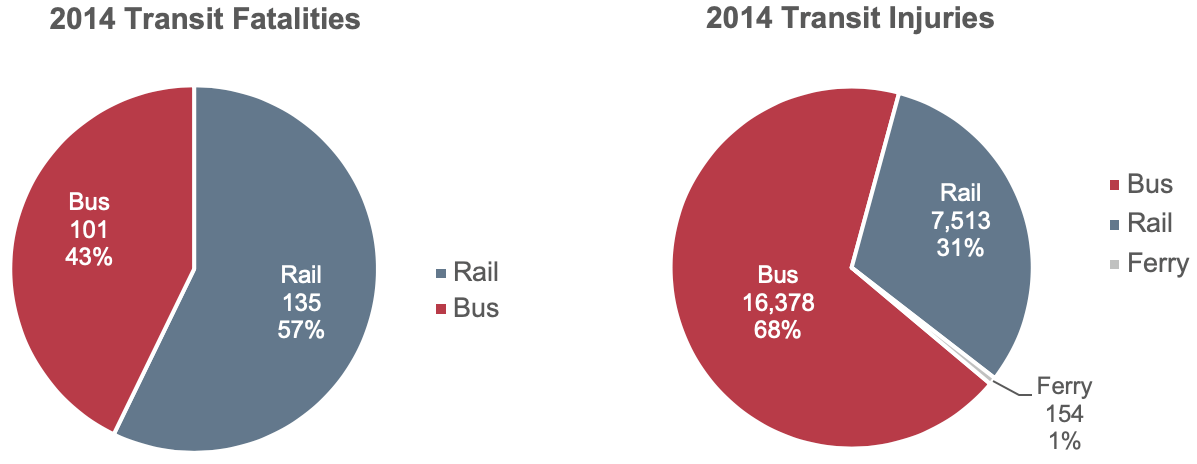
Source: National Transit Database - Transit Safety and Security Statistics and Analysis Reporting.
Exhibit 5-14 shows fatalities per 100 million PMT for fixed-route bus and demand-response (including suicides). The fatality rate for demand-response transit is more volatile than for fixed-route bus. This observation is not unexpected, as fewer people use demand-response transit and even one or two more fatalities in a year can make the rate jump significantly. Fatality rates have not changed significantly for fixed-route bus. Note that the absolute number of fatalities is not comparable across modes because of the wide range of PMT on each mode.
Exhibit 5-14: Annual Transit Fatality Rates by Highway Mode, 2004–2014
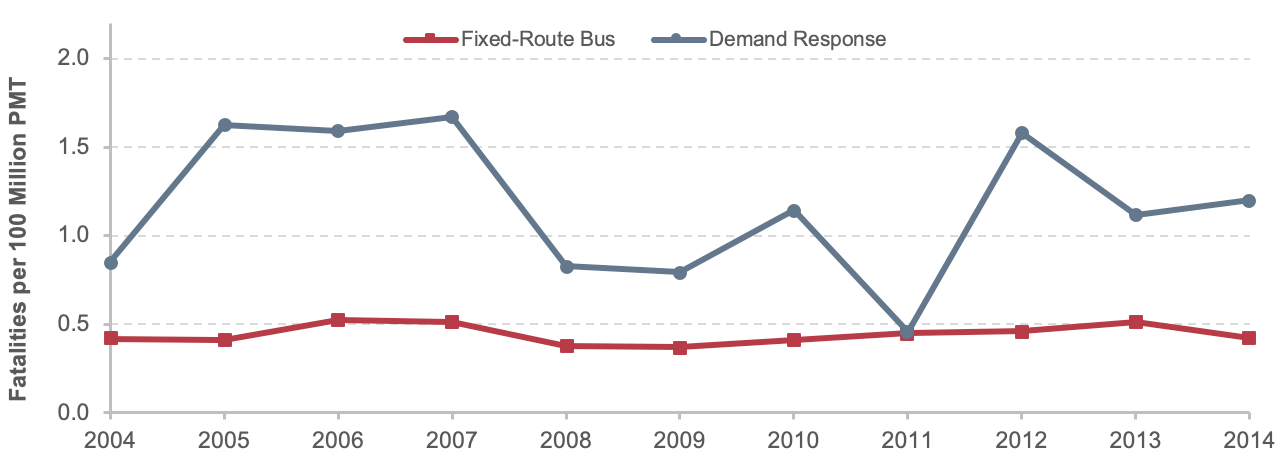
Note: Fatality totals include both DO and PT service types.
Source: National Transit Database.
Exhibit 5-15 shows fatalities per 100 million PMT for heavy rail and light rail (including suicides). Heavy-rail fatality rates remained relatively stable from 2004 through 2014. Suicides represent a large share of fatalities for heavy rail—approximately 69 percent in 2014. Light rail experienced more incidents than did heavy rail, as many systems are streetcars operating in nondedicated guideways.
Exhibit 5-15: Annual Transit Fatality Rates by Rail Mode, 2004–2014
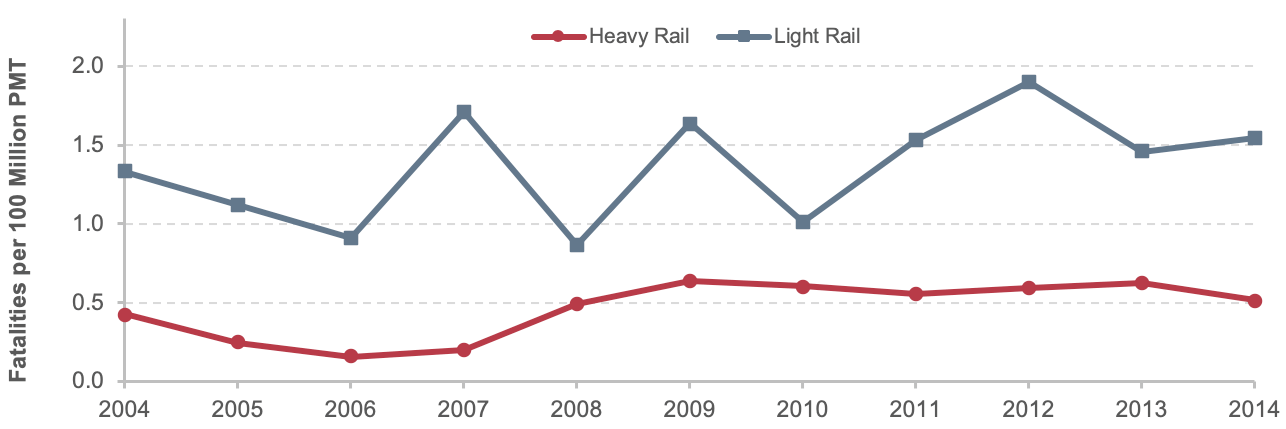
Note: Fatality totals include both DO and PT service types.
Source: National Transit Database.
The analysis that follows shows data for all major modes reported in NTD with the exception of commuter rail. Safety data for commuter rail are included in FRA’s Rail Accident/Incident Reporting System (RAIRS). The RAIRS database records fatalities that occurred because of a commuter rail collision, derailment, or fire. The database also includes a category called “not otherwise classified,” which includes fatalities that occurred because of a slip, trip, or fall. Before 2011, RAIRS did not include a separate category for suicides, which are reported in NTD for all modes. Therefore, for comparative purposes, suicides are excluded from this analysis.
Exhibit 5-16 shows incidents and injuries per 100 million PMT reported in NTD for the two main highway modes in transit, fixed-route bus and demand-response, and two main rail modes, heavy rail and light rail. The data in Exhibit 5-16 suggest that the incidents in highway modes (fixed-route bus and demand-response) decreased between 2004 and 2014. Injuries for fixed-route bus remained relatively flat, especially compared with injuries for demand-response transit, given per 100 million PMT. Data for rail modes show a decreasing trend in incidents per 100 million PMT; decreasing from 2010 through 2014 for heavy rail and 2005 through 2014 for light rail. As for injuries per 100 million PMT, heavy-rail-involved injuries have decreased since 2010, whereas light-rail-involved injuries have decreased since 2005.
Exhibit 5-16: Transit Incidents and Injuries by Mode, 2004–2014
| Analysis Parameter | 2004 | 2005 | 2006 | 2007 | 2008 | 2009 | 2010 | 2011 | 2012 | 2013 | 2014 |
|---|---|---|---|---|---|---|---|---|---|---|---|
| Incidents Per 100 Million PMT | |||||||||||
| Fixed-Route Bus | 66.2 | 65.6 | 69.6 | 66.9 | 54.1 | 58.3 | 55.3 | 46.3 | 45.2 | 47.6 | 49.1 |
| Heavy Rail | 43.8 | 39.4 | 42.9 | 43.5 | 53.3 | 53.2 | 54.6 | 49.4 | 48.6 | 49.9 | 41.2 |
| Light Rail | 59.5 | 66.1 | 60.7 | 61.3 | 48.6 | 45.8 | 40.1 | 39.7 | 36.9 | 40.7 | 41.4 |
| Demand Response | 292.3 | 326.8 | 375.1 | 404.1 | 204.3 | 194.8 | 165.2 | 151.8 | 142.5 | 154.0 | 165.3 |
| Injuries Per 100 Million PMT | |||||||||||
| Fixed-Route Bus | 70.5 | 68.1 | 62.6 | 68.9 | 66.9 | 72.3 | 72.0 | 62.9 | 62.7 | 65.3 | 66.9 |
| Heavy Rail | 43.8 | 39.4 | 42.9 | 43.5 | 53.3 | 53.2 | 54.6 | 49.4 | 48.6 | 49.9 | 41.2 |
| Light Rail | 59.5 | 66.1 | 60.7 | 61.3 | 48.6 | 45.8 | 40.1 | 39.7 | 36.9 | 40.7 | 41.4 |
| Demand Response | 292.3 | 326.8 | 375.1 | 404.1 | 204.3 | 194.8 | 165.2 | 151.8 | 142.5 | 154.0 | 165.3 |
Source: National Transit Database.
Exhibit 5-17 shows the number of fatalities, and the fatality rate, for commuter rail. These data were obtained from FRA’s RAIRS (suicides not included). In 2014, 175 fatalities (excluding suicides) were recorded in NTD for all modes except commuter rail. The fatality rate per 100 million transit PMT (excluding suicides and commuter rail) was 0.39. For commuter rail, however, the total number of fatalities in 2014 was 85, with a fatality rate of 0.73—significantly higher than the national aggregate rate for transit. The national rate with suicides included is 0.53, which is less than the rate for commuter rail.
Exhibit 5-17: Commuter Rail Fatalities, 2004–2014
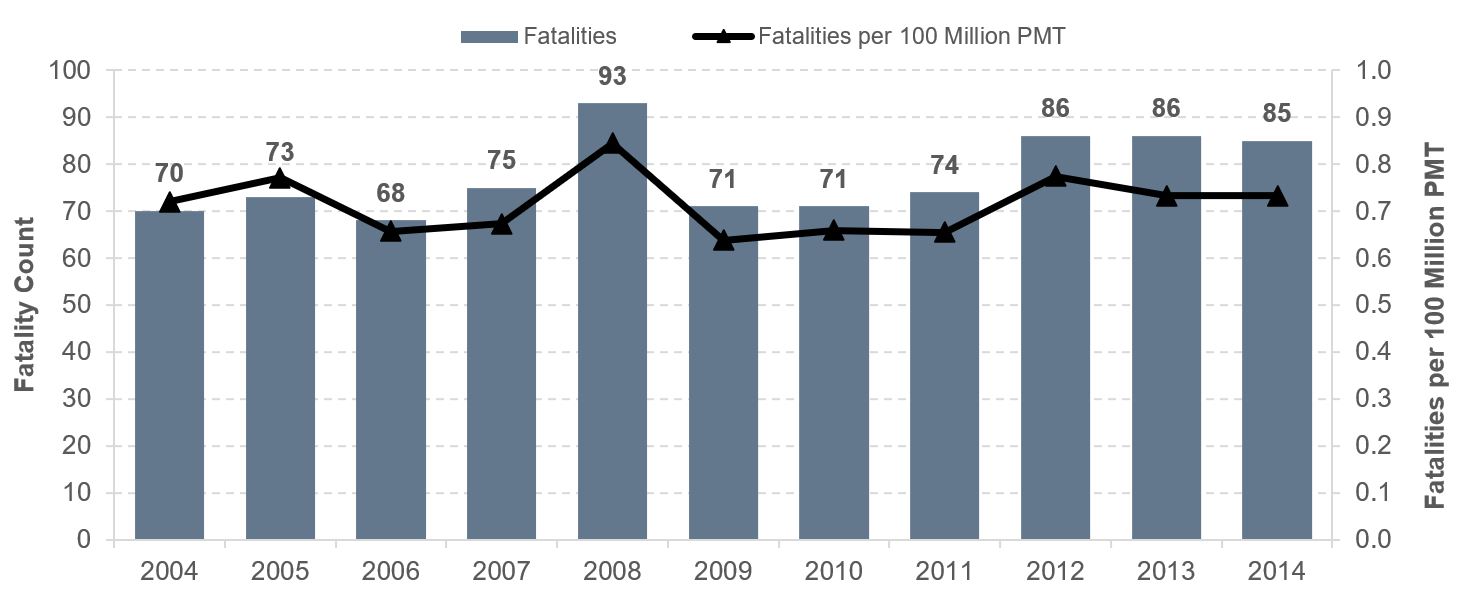
Source: Federal Railroad Administration Rail Accident/Incident Reporting System.
Exhibits 5-18 and 5-19 show the number of commuter rail incidents and the number of injuries per 100 million PMT, respectively. Although commuter rail has a very low number of incidents per PMT, commuter rail incidents are far more likely to result in fatalities than incidents occurring on any other mode. One contributing factor could be that the average speed of commuter rail vehicles is considerably higher than the average speeds of other modes (except vanpools). The number of both incidents and injuries declined from 2007 to 2008, steadily increased through 2010, then declined again between 2011 and 2012 before increasing in 2013. Injuries continued to increase through 2014, whereas incidents decreased through 2014. The average rates of increase for commuter rail fatalities, incidents, and injuries from 2004 to 2014 are 2.7 percent, 3.1 percent, and 5.5 percent, respectively.
Exhibit 5-18: Commuter Rail Incidents, 2004–2014
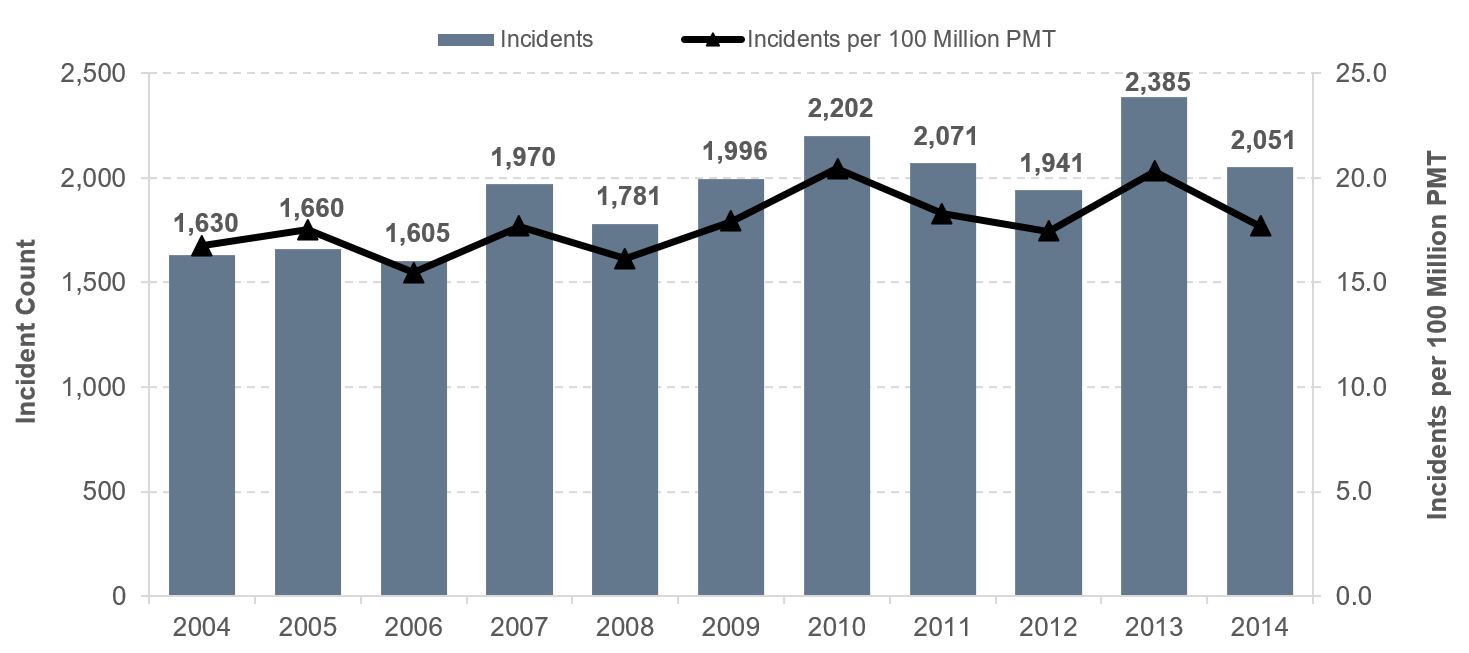
Source: Federal Railroad Administration Rail Accident/Incident Reporting System.
Exhibit 5-19: Commuter Rail Injuries, 2004–2014
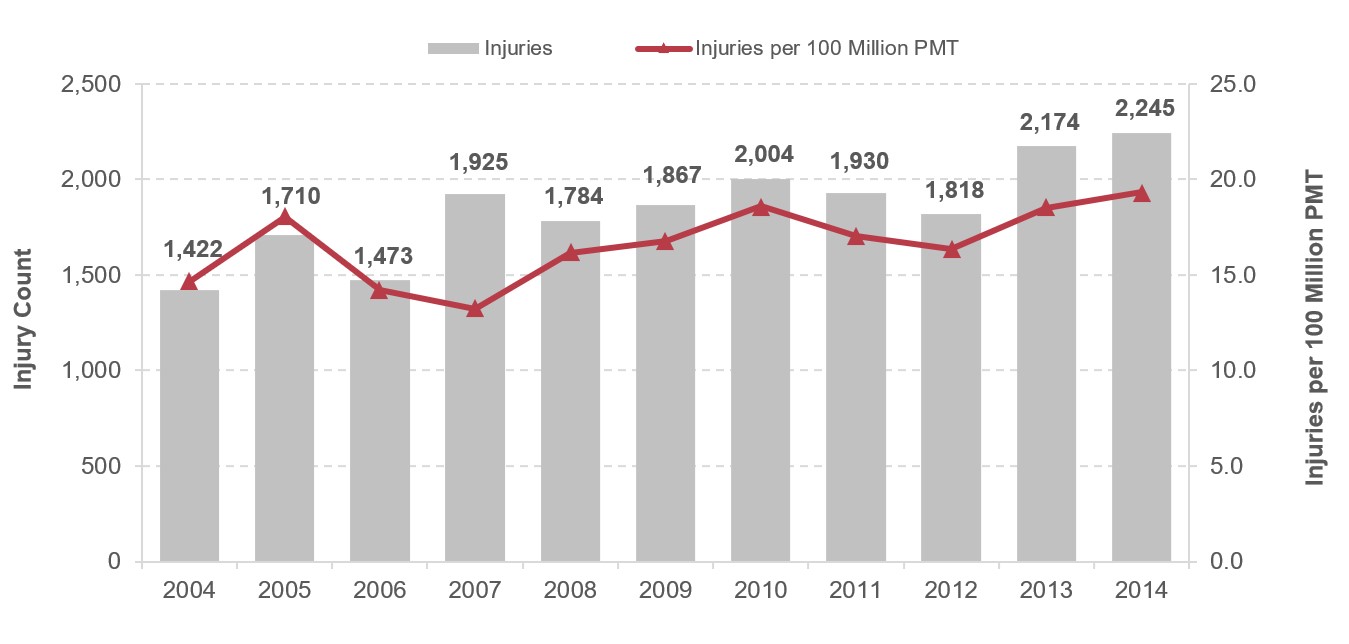
Source: Federal Railroad Administration Rail Accident/Incident Reporting System.
i 2014 Annual Report: The U.S. Department of Transportation’s (DOT) Status of Actions Addressing the Safety Issue Areas on the National Transportation Safety Board’s Most Wanted List. [Return to Section]