

Chapter 1: System Assets

Key Takeaways
- The number of lane miles on the Nation’s roadways increased by 4.7 percent, or almost 393,779 lane miles, between 2004 and 2014.
- The amount of bridge deck area increased by approximately 12.3 percent between 2004 and 2014.
- The National Highway System has 5.4 percent of the Nation’s highway mileage, 8.8 percent of the Nation’s lane mileage, 23.4 percent of the Nation’s bridges, and 57.8 percent of the bridge deck area in the Nation.
- In 2014, approximately 54.6 percent of the Nation’s total Vehicle Miles Traveled (VMT) and approximately 82.9 percent of the VMT by combination trucks occurred on the National Highway System.
- Local governmental agencies own 74.8 percent of the Nation’s highway lane mileage and 22.3 percent of the bridge deck area in the Nation.
- State agencies own the majority of bridge deck area, 76.7 percent, in the Nation.
Highway System Assets
The Nation’s extensive network of roadways, bridges, and culverts facilitates movement of people and goods, promotes the growth of the American economy, affords access to national and international markets, and supports national defense by providing the means for rapid deployment of military forces and their support systems.
This chapter explores the characteristics of the Nation’s roadways, bridges, and culverts in terms of ownership, purpose, and use. Information is presented for the National Highway System (NHS), including its Interstate Highway System component, and for the overall highway system. Separate statistics are presented for Federal-aid highways, which include roadways, bridges, and culverts that are generally eligible for Federal assistance under current law. Subsequent sections within this chapter explore the characteristics of bridges, culverts, and transit systems.
Road statistics reported in this section draw on data collected from States through the Highway Performance Monitoring System (HPMS). The terms highways, roadways, and roads are generally used interchangeably in this section and elsewhere in the report. Roadways in a community with a population of 5,000 or more are classified as urban; all other roadways are classified as rural.
Bridge and culvert statistics reported in this section draw on data collected from States through the National Bridge Inventory (NBI). This information details physical characteristics, traffic loads, and the evaluation of the condition of each bridge and culvert longer than 20 feet (6.1 meters). As of December 2015, the NBI contained records for 611,845 bridges and culverts. Data for input to NBI are collected regularly as set forth in the National Bridge Inspection Standards.
The Nation’s Roads and Bridges
The Nation’s road network is diversely constructed to fit the needs of its surrounding environment. For example, roads in an urban setting will often have multiple lanes on a facility to support high levels of demand, while a rural setting will have fewer lanes supporting lower traffic levels. Highway mileage measures road distances from one point to another while lane mileage accounts for the number of lanes in operation. As shown in Exhibit 1-1, highway mileage and its accompanying lane mileage have increased between 2004 and 2014, at an average annual rate of 0.4 percent and 0.5 percent, respectively. With population growth expected throughout the Nation, State and local governments are adding and increasing capacity throughout the road network.
Exhibit 1-1: Highway Extent and Travel, 2004–2014; Bridge Extent and Crossings, 2004–2015
| 2004 | 2006 | 2008 | 2010 | 2012 | 2014 | Annual Rate of Change 2014/2004 | 2015 | |
|---|---|---|---|---|---|---|---|---|
| Highway Miles | 3,997,462 | 4,032,011 | 4,059,352 | 4,083,768 | 4,109,418 | 4,177,074 | 0.4% | |
| Lane Miles | 8,372,270 | 8,460,352 | 8,518,776 | 8,616,206 | 8,641,051 | 8,766,049 | 0.5% | |
| VMT (trillions) | 2.982 | 3.034 | 2.993 | 2.985 | 2.987 | 3.040 | 0.2% | |
| Person-Miles Traveled (trillions)1 | 4.876 | 4.961 | 4.931 | 5.063 | 5.050 | 5.205 | 0.7% | |
| Bridges | 591,707 | 597,561 | 601,506 | 604,493 | 607,380 | 610,749 | 0.3% | 611,845 |
| Bridge Deck Area (millions of square meters) | 325.5 | 333.9 | 343.5 | 351.5 | 358.5 | 365.5 | 1.2% | 369.1 |
| Annual Daily Traffic over Bridges (billions)2 | 4.119 | 4.277 | 4.432 | 4.439 | 4.485 | 4.504 | 0.9% | 4.563 |
1 Values for 2004, 2006, and 2008 were based on a vehicle occupancy rate of approximately 1.63 based on data from the 2001 National Household Travel Survey (NHTS). Values for 2010, 2012, and 2014 were based on a vehicle occupancy rate of approximately 1.70 based on data from the 2009 NHTS. Includes estimated values for Puerto Rico PMT.
2 Average Daily Traffic (ADT) identifies the volume of traffic over all bridges for a one day (24-hour period) during a data reporting year.
Sources: Highway Performance Monitoring System; Highway Statistics, Table VM-1, various years; National Bridge Inventory.
Vehicle miles traveled (VMT) measures the distance each vehicle traverses the Nation’s road network in a year. Person-miles traveled weights travel by the number of occupants in a vehicle. As shown in Exhibit 1-1, total highway VMT grew at an average annual rate of 0.2 percent between 2004 and 2014. Annual VMT growth fluctuated significantly during this period, and declined relative to the preceding year in 2008, 2009, and 2011. The first two of these three reductions in VMT can be attributed partially to the period of economic contraction in 2008–2009. The largest annual increase over the 10-year period was a 1.2-percent growth in VMT between 2013 and 2014.
Person-miles of travel increased by an average annual rate of 0.7 percent from 2004 to 2014. This is attributable to an increase in VMT and an increase in the average vehicle occupancy as measured in the 2009 National Household Travel Survey (NHTS), used to estimate person-miles of travel for 2014, relative to the 2001 NHTS, which was used to estimate person-miles of travel for 2004.
VMT Trends Since 2014
Based on Highway Statistics Table VM-2, VMT grew by 2.3 percent to 3.110 trillion in 2015, by an additional 2.5 percent to 3.189 trillion in 2016, and by an additional 1.2 percent to 3.227 trillion in 2017.
According to the December 2018 Traffic Volume Trends (TVT) report, the preliminary estimate of VMT growth from 2017 to 2018 is 0.4 percent. The TVT report is a monthly report based on hourly traffic count data. These data, collected at approximately 4,000 continuous traffic-counting locations nationwide, are used to calculate the percentage change in traffic for the current month compared with the same month in the previous year. Because of limited TVT sample sizes, caution should be used with these estimates.
For additional information on ongoing traffic trends, visit (http://www.fhwa.dot.gov/ohim/tvtw/tvtfaq.cfm).
Exhibit 1-1 also shows that the number of bridges cataloged in NBI increased at an annual rate of 0.3 percent between 2004 and 2014, from 591,707 to 610,749, rising further to 611,845 in 2015. Total bridge deck area grew at an average annual rate of 1.2 percent, while bridge crossings (measured as annual daily traffic) increased at an average annual rate of 0.9 percent.
Tunnels
Under MAP-21, FHWA was charged with establishing a national tunnel inspection program. In 2015, development began on the National Tunnel Inventory database system, and inventory data were collected for all highway tunnels reported. Concurrently, FHWA implemented an extensive program to train inspectors nationwide on tunnel inspection and condition evaluation.
The 2015 preliminary inventory included 473 tunnels. Of these, 271 (57.3 percent) are on the NHS. States own 304 (64.3 percent) of the tunnels, 83 (17.5 percent) are owned by local governments, 77 (16.3 percent) are owned by Federal agencies, and 9 (1.9 percent) are owned by others. Further information can be found at (https://www.fhwa.dot.gov/bridge/inspection/tunnel/).
Complete inventory and condition data for all tunnels will be collected annually, beginning in 2018, and will be available for use in subsequent C&P Reports.
Roads and Bridges by Ownership
State and local governments own the vast majority of public roads and the bridges and culverts located on these roads. As shown in Exhibit 1-2, local governments own 77.4 percent of the Nation’s public road mileage and 49.8 percent of all bridges. State governments own 18.7 percent of public road mileage and 48.3 percent of the Nation’s bridges. Although many roads and bridges are constructed or improved with Federal funding, State and local governments assume ownership responsibilities for maintaining those facilities and keeping them safe for public use. Federally-owned facilities are generally found only on Federal lands, such as national parks and military installations.
Exhibit 1-2: Highway (2014) and Bridge (2015) Ownership by Level of Government
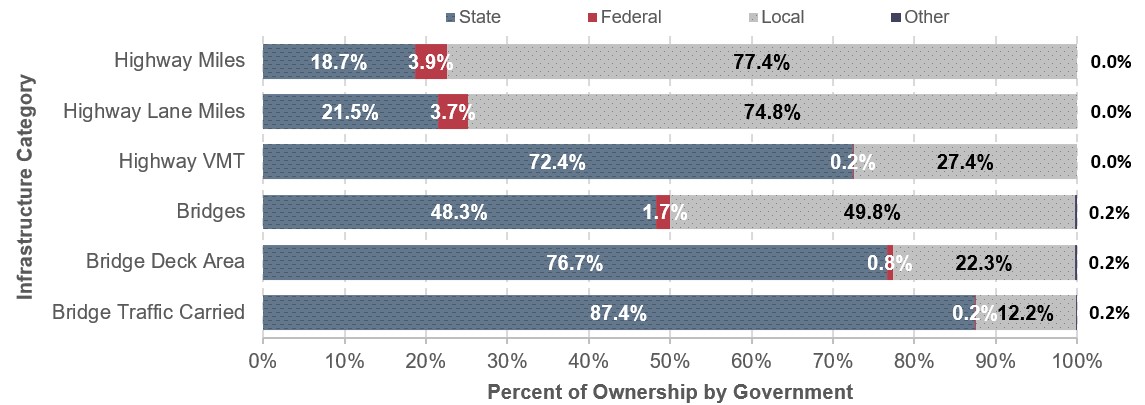
Source: Highway Performance Monitoring System and National Bridge Investment Analysis System.
Roads and Bridges by Federal System
The mileage eligible for Federal-aid highway assistance is much smaller than the total road mileage throughout the Nation. Federal-aid highway assistance mileage consists of longer routes that may cross multiple States and facilitate higher traffic volumes at increased speeds. Conversely, non-Federal-aid highway mileage generally consists of shorter and smaller roads that eventually feed into the larger facilities that are eligible for Federal assistance.
The NHS is a subset of Federal-aid highways, containing the most critical routes for passenger and goods movement. The Interstate System is a subset of the NHS. The NHS and Interstate System are discussed in more detail below. Exhibit 1-3 compares the relative magnitudes of these systems to the total extent of the Nation’s highways and bridges.
Exhibit 1-3: Interstate, NHS, and Federal-aid Highway Extent, Bridge Count, and Travel, 2014
| Interstate | NHS | FAH | All | Share of Total | |||
|---|---|---|---|---|---|---|---|
| Interstate | NHS | FAH | |||||
| Highway Miles | 47,944 | 226,767 | 1,016,963 | 4,177,074 | 1.1% | 5.4% | 24.3% |
| Lane Miles | 221,229 | 771,245 | 2,445,967 | 8,766,049 | 2.5% | 8.8% | 27.9% |
| VMT (trillions) | 0.751 | 1.661 | 2.572 | 3.040 | 24.7% | 54.6% | 84.6% |
| Bridges | 56,553 | 143,165 | 325,467 | 610,749 | 9.3% | 23.4% | 53.3% |
Sources: Highway Performance Monitoring System; National Bridge Inventory.
Ownership of Federal-aid Highway Components
In addition to the Interstate System and NHS, federally assisted highway mileage is found on other routes. Based on mileage, State highway agencies own the vast majority of the Interstate and NHS: State highway agencies own 94.7 percent of the Interstate System and 89.3 percent of the NHS. In contrast, the Federal government owns none of the 47,960 Interstate System mileage and less than 0.2 percent of the 226,767 NHS mileage. Local levels of government own the remaining mileage.
State highway agencies own 55.7 percent of the 1,016,963 miles of Federal-aid highways, while the Federal government owns only 0.8 percent of those miles.
Source: Highway Statistics HM-15 2014
Federal-aid highways constitute just 24.3 percent of the Nation’s roadway mileage, but carry 84.6 percent of the Nation’s VMT. The NHS includes 5.4 percent of the Nation’s roadway mileage, but carries 54.6 percent of highway traffic. The Interstate System makes up only 1.1 percent of the Nation’s roads, but carries 24.7 percent of VMT.
The Interstate System and the NHS have more multilane roadways (four lanes or more), and include bridges with greater deck areas. Roadways not on these systems tend to have the vast majority of two-lane roadways and slightly less than 50 percent of bridges. However, a bridge not on either the Interstate System or the remainder of the NHS usually has a much smaller deck area to maintain and is not subject to as much traffic.
Federal-aid Highways
Federal-aid highways comprised approximately 1.02 million miles in 2014 and facilitated more than 2.57 trillion VMT. As shown in Exhibit 1-4, highway mileage on the Federal-aid system increased by 49,425 miles between 2004 and 2014, to over 1.02 million miles in 2014. Lane mileage increased by 126,250 miles to almost 2.45 million lane miles in 2014 and VMT increased from 2.53 trillion in 2004 to over 2.57 trillion VMT in 2014, an increase of more than 40 billion VMT.
The number of bridges on Federal-aid highways increased from 307,840 in 2004 to 325,467 in 2014. This is an annual rate of change of approximately 0.5 percent. A net total of 1,279 bridges were added in 2015, bringing the total to 326,746.
Exhibit 1-4: Federal-Aid Highways Extent and Travel, 2004–2014; Bridge Count 2004–2015
| 2004 | 2006 | 2008 | 2010 | 2012 | 2014 | Annual Rate of Change 2014/2004 |
2015 | |
|---|---|---|---|---|---|---|---|---|
| Highway Miles | 971,036 | 984,093 | 994,358 | 1,007,777 | 1,005,378 | 1,020,461 | 0.5% | |
| Lane Miles | 2,319,417 | 2,364,514 | 2,388,809 | 2,451,140 | 2,433,012 | 2,445,667 | 0.5% | |
| VMT (trillions) | 2.532 | 2.574 | 2.534 | 2.525 | 2.527 | 2.572 | 0.2% | |
| Bridges | 307,840 | 312,062 | 316,012 | 319,108 | 321,724 | 325,467 | 0.5% | 326,746 |
Sources: Highway Performance Monitoring System; National Bridge Inventory.
National Highway System
With the Interstate System largely complete, the Intermodal Surface Transportation Efficiency Act of 1991 (ISTEA) revised the Federal-aid highway program for the post-Interstate System era. The legislation authorized designation of an NHS that would give priority for Federal resources to roads most important for interstate travel, economic expansion, and national defense; that connect with other modes of transportation; and that are essential to the Nation’s role in the international marketplace. The Moving Ahead for Progress in the 21st Century Act of 2012 (MAP-21) modified the scope of the NHS to include some additional principal arterial and related connector mileage not previously designated as part of the NHS. This modification increased the size of the NHS by approximately 37 percent, bringing it from 164,154 miles in 2011 up to an estimated 224,446 miles.i The NHS has subsequently grown to 226,767 miles as of 2014.
Exhibit 1-5 compares the NHS in 2004 with the NHS in 2014 after the expansion under MAP-21. As of 2014, the NHS included 39.6 percent more mileage and carried 24.7 percent more travel than in 2004.
Exhibit 1-5: NHS Comparison: 2004 versus 2014
| Year | Percent Increase | ||
|---|---|---|---|
| 2004 | 2014 | ||
| Miles | 162,161 | 226,767 | 39.8% |
| Lane-miles | 559,830 | 771,248 | 37.8% |
| VMT (trillions) | 1.332 | 1.661 | 24.7% |
| Bridges | 115,103 | 143,165 | 24.4% |
| Deck Area (sq. m.) | 160,481,200 | 211,704,373 | 31.9% |
Source: HPMS, NBI.
The number of NHS bridges was 24.4 percent higher in 2014 than in 2004, though the 2014 figure may not be exact as final recoding of newly designated NHS bridges in the NBI was still in progress at the time of this report.
The NHS was designed to be a dynamic system capable of changing in response to future travel and trade demands. States must cooperate with local and regional officials in proposing modifications. In metropolitan areas, local and regional officials must act through metropolitan planning organizations and the State transportation department when proposing modifications. Many of these modifications are proposed and approved each year.
The NHS has five components. The first, the Interstate System, is the core of the NHS and includes the most traveled routes. The second component includes other principal arterials deemed most important for commerce and trade. The third is the Strategic Highway Network (STRAHNET), which consists of highways important to military mobilization. The fourth is the system of STRAHNET connectors that provide access between major military installations and routes that are part of STRAHNET. The final component consists of intermodal connectors. These roads provide access between major intermodal passenger and freight facilities and the other four subsystems that comprise the NHS.
As shown in Exhibit 1-6, only 5.4 percent of the Nation’s highway mileage and 8.8 percent of the Nation’s lane mileage were located on the NHS in 2014. Of the total number of the Nation’s bridges, 23.4 percent are located on the NHS. However, these bridges account for 57.9 percent of the total bridge deck area in the Nation. Approximately 54.6 percent of the Nation’s total VMT occurs on the NHS. The NHS is crucial to truck traffic, which carries cargo long distances, often across multiple State lines. Approximately 82.9 percent of combination truck VMT occurred on the NHS in 2014. Freight transportation is discussed in more detail in Part III of this report.
Exhibit 1-6: Share of Highway Miles, Lane Miles, Vehicle Miles Traveled, Truck Vehicle Miles, Bridge Deck Area, and Number of Bridges On and Off the National Highway System, 2014
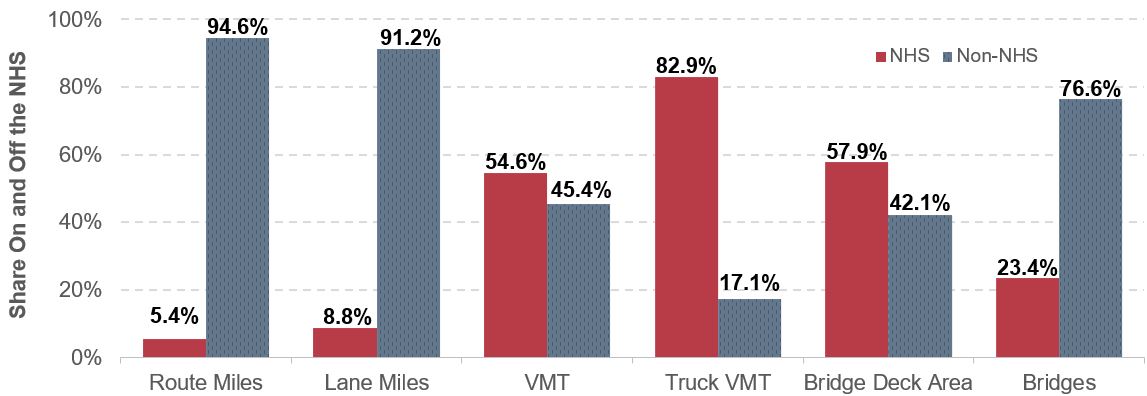
Source: Highway Performance Monitoring System, National Bridge Information System.
In view of the importance of the NHS for truck traffic and freight, highways that are part of the NHS are designed to accommodate high amounts of traffic at higher speeds in the safest and most efficient ways possible. Additionally, NHS highways are constructed at higher load carrying capability to withstand the heavier loads conveyed by combination trucks.
Interstate System
The Federal-Aid Highway Act of 1956 declared that the completion of the “National System of Interstate and Defense Highways” was essential to the national interest. The Act committed the Nation to completing the Interstate System within the Federal-State partnership of the Federal-aid highway program, with the States responsible for construction according to approved standards. The Act also resolved the challenging issue of how to pay for construction by establishing the Highway Trust Fund to ensure that revenue from highway user taxes, such as the motor fuels tax, would be dedicated to the Interstate System and other Federal-aid highway and bridge projects.
As shown in Exhibit 1-7, there were small increases in the size of the Interstate System from 2004 to 2014. The total number of route miles increased from 46,836 miles in 2004 to 47,960 miles in 2014. Lane miles increased from 212,029 lane miles in 2004 to 222,588 lane miles in 2014. The number of bridges increased as well.
Exhibit 1-7: Interstate Highway Extent and Travel, 2004–2014; Bridge Count, 2004–2015
| 2004 | 2006 | 2008 | 2010 | 2012 | 2014 | Annual Rate of Change 2014/2004 |
2015 | |
|---|---|---|---|---|---|---|---|---|
| Highway Miles | 46,836 | 46,892 | 47,019 | 47,182 | 47,714 | 47,960 | 0.2% | |
| Lane Miles | 212,029 | 213,542 | 214,880 | 217,165 | 220,124 | 222,588 | 0.5% | |
| VMT (trillions) | 0.727 | 0.741 | 0.725 | 0.731 | 0.736 | 0.751 | 0.3% | |
| Bridges | 55,315 | 55,270 | 55,626 | 55,339 | 55,959 | 56,553 | 0.2% | 56,883 |
Sources: Highway Performance Monitoring System; National Bridge Inventory.
Roads and Bridges by Purpose
The Nation’s roadway system is a vast network that connects places and people within and across national borders. The network serves movements from long-distance freight needs to neighborhood travel. Because of the diverse needs for vehicular travel, the network is categorized under the Highway Functional Classification System. Each functional classification defines the role an element of the network plays in serving travel needs.
Exhibit 1-8 presents a formal hierarchy of road functional classifications. (Highway Functional Classification Concepts, Criteria and Procedures 2013). Although the functional classification definitions do not change for each setting, roads are divided into rural and urban classifications.
Arterials serve the longest distances with the fewest access points. Because they have the longest distance between other routes, arterials facilitate the highest speed limits. Several functional classifications are included in the arterial category.
- Interstates are the highest classification of arterials, facilitating the highest level of mobility. Interstates are relatively easy to locate due to their official designation by the Secretary of Transportation and distinct signage.
- Other Freeways and Expressways are similar to Interstates in that they have directional travel lanes, usually separated by a physical barrier. Access and egress points are limited primarily to on- and off-ramps at grade-separated interchanges.
- Other Principal Arterials can serve specific land parcels directly and have at-grade intersections with other roadways that are managed by traffic devices.
- Minor Arterials, the lowest of arterial classifications, provide service for trips of moderate length and connectivity between higher arterial classifications and roads with lower functional classifications that provide greater access to businesses and homes.
Collectors serve the critical roles of gathering traffic from local roads and funneling vehicles into the arterial network. Although subtly different, two classifications are included in the collector category.
- Major Collectors are longer, have fewer points of access, have higher speed limits, and can have more travel lanes.
- Minor Collectors is the classification used for all collectors not classified as major collectors. One distinction between the two classifications is that minor collectors are focused more on access than on mobility.
Exhibit 1-8: Highway Functional Classification System Hierarchy
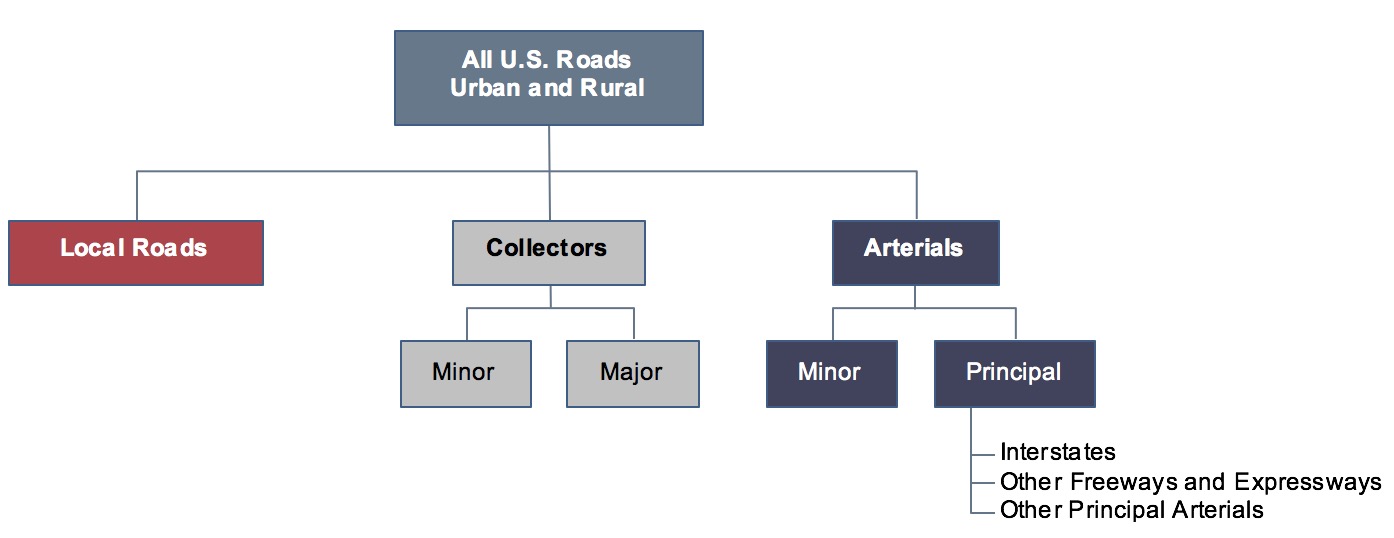
Source: FHWA Functional Classification Guidelines.
Local Roads are any road not classified as an arterial or collector. They are not intended for use in long-distance travel, except at the origination or termination of a trip. Local roads are often designed to discourage through traffic. (Local functional class should not be confused with local government ownership: the Federal government and State governments own some roadways functionally classified as local.)
Relationship of Federal-aid Highways to Functional Classes
Public roads that are functionally classified higher than rural minor collector, rural local, or urban local are eligible for Federal-aid highway assistance. Although bridges follow the hierarchy scheme, the NBI makes no distinction between urban major and urban minor collectors as HPMS does. Title 23 allows Federal-aid highway funding (specifically Surface Transportation Block Grant Program apportionments) to be used on existing bridges and tunnels that are not on the Federal-aid highways. MAP-21 required each State to obligate at least 15 percent of its 2009 bridge program apportionment for bridges that are not on Federal-aid highways, unless the Secretary determines such expenditures are unjustified.
Extent and Travel by Functional System
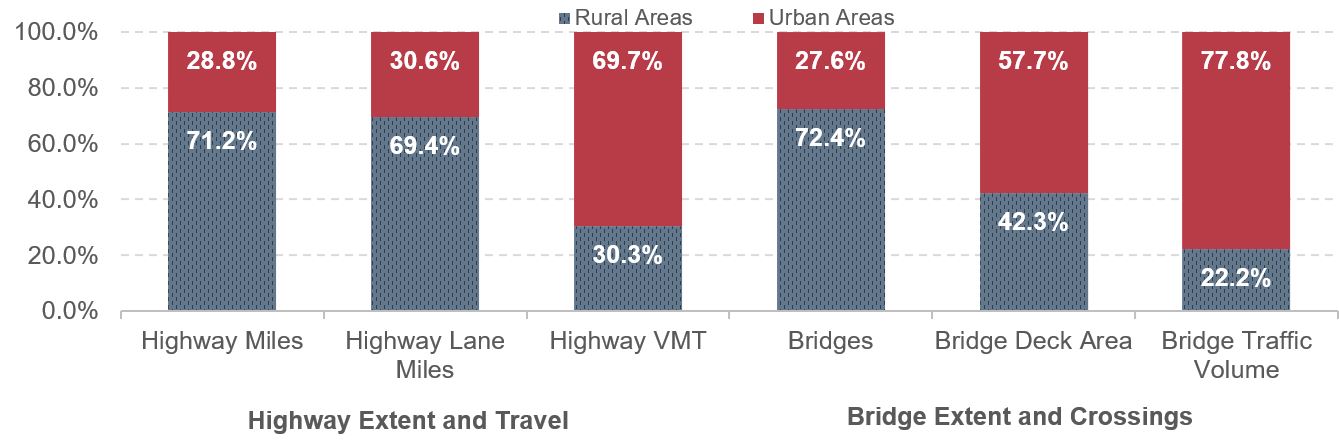
As shown in Exhibit 1-9, almost half (49.1 percent) of the Nation’s highway mileage was classified as rural local in 2014 highway mileage. Urban local roads comprised an additional 20.4 percent of total highway miles.
Exhibit 1-9 also details the breakdown of travel occurring in rural and urban settings. Urban areas have a higher share of VMT and lower highway mileage because urban settings tend to be more consolidated environments. With higher population concentrations, more vehicles use the highway mileage in urban areas. Alternatively, rural areas cover much more land across the country and have a higher share of the highway mileage to provide connectivity and access in areas with lower population density.
Exhibit 1-9: By Functional System and Area: Highway Extent and Travel, 2014; Bridge Extent and Crossings, 2015
| Functional System | Highway Miles | Highway Lane Miles | Highway VMT | Bridges | Bridge Deck Area | Bridge Traffic Volume |
|---|---|---|---|---|---|---|
| Rural Areas (less than 5,000 in population) | ||||||
| Interstate | 0.7% | 1.4% | 7.6% | 4.1% | 6.8% | 8.7% |
| Other Freeway and Expressway | 0.1% | 0.2% | 0.9% | |||
| Other Principal Arterial | 2.2% | 2.7% | 6.2% | |||
| Other Principal Arterial1 | 6.0% | 8.8% | 5.7% | |||
| Minor Arterial | 3.2% | 3.1% | 4.6% | 6.2% | 5.8% | 2.9% |
| Major Collector | 9.8% | 9.4% | 5.2% | 15.1% | 8.9% | 2.9% |
| Minor Collector | 6.2% | 5.9% | 1.6% | 7.8% | 3.1% | 0.7% |
| Local | 49.1% | 46.7% | 4.1% | 33.2% | 8.9% | 1.3% |
| Subtotal Rural Areas | 71.2% | 69.4% | 30.3% | 72.4% | 42.3% | 22.2% |
| Urban Areas (5,000 or more in population) | ||||||
| Interstate | 0.4% | 1.2% | 17.3% | 5.2% | 19.5% | 36.1% |
| Other Freeway and Expressway | 0.3% | 0.6% | 7.5% | 3.4% | 11.0% | 16.6% |
| Other Principal Arterial | 1.6% | 2.6% | 15.5% | 4.8% | 11.7% | 12.3% |
| Minor Arterial | 2.7% | 3.3% | 12.9% | 5.0% | 8.1% | 7.6% |
| Collector1 | 3.7% | 3.7% | 2.8% | |||
| Major Collector | 3.1% | 3.1% | 6.4% | |||
| Minor Collector | 0.3% | 0.3% | 0.4% | |||
| Local | 20.4% | 19.5% | 9.7% | 5.6% | 3.9% | 2.3% |
| Subtotal Urban Areas | 28.8% | 30.6% | 69.7% | 27.6% | 57.7% | 77.8% |
| Total | 100.0% | 100.0% | 100.0% | 100.0% | 100.0% | 100.0% |
1 Highway data reflect revised HPMS functional classifications. Bridge data still use the previous classifications, so that rural Other Freeway and Expressway is included as part of the rural Other Principal Arterial category, and urban Major Collector and urban Minor Collector are combined into a single urban Collector category.
Sources: Highway Performance Monitoring System; National Bridge Inventory.
Although Interstate highway mileage comprises only 1.1 percent of the Nation’s highway mileage, it carries the Nation’s highest share of VMT by classification at 24.9 percent. Interstate bridges also receive the highest share of bridge traffic volume by classification with 44.8 percent.
Because 71.2 percent of the Nation’s highway mileage is located in rural areas, lane mileage is also higher in rural areas. Local roads in urban and rural settings also continue to have the highest share of the Nation’s lane mileage.
The difference seen in Exhibit 1-9 between the functional classes reported under the highway portion of the exhibit and the bridge portion is due to the fact that the NBI has not been updated to use the new functional classifications used in the HPMS.
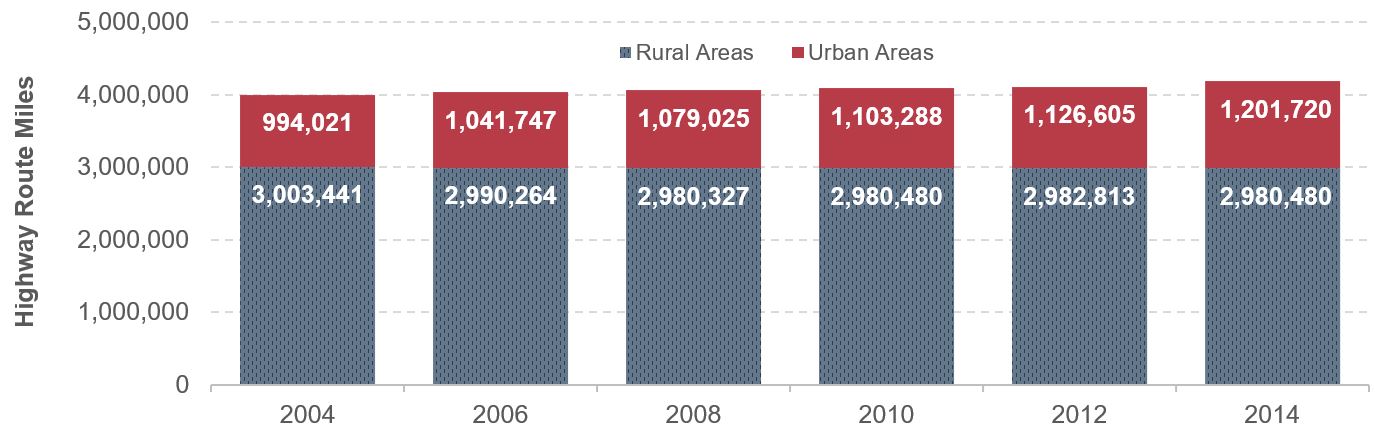
Exhibit 1-10 shows the highway route miles in the Nation based on functional system. The Nation’s public highways comprised approximately 4.18 million miles in 2014, up from slightly less than 4.0 million miles in 2004. Total mileage in urban areas grew from 994,221 miles in 2004 to 1,201,720 miles in 2014. Highway miles in rural areas, however, decreased from approximately 3.0 million miles in 2004 to slightly more than 2.98 million miles in 2014. The largest decrease in mileage was seen in rural local roadways.
In addition to the construction of new roads, two factors have continued to contribute to the increase in urban highway mileage. First, based on population growth reflected in the decennial census, more people are living in areas that were previously rural, and thus urban boundaries have expanded in some locations. This expansion has resulted in the reclassification of some mileage from rural to urban. States have implemented these boundary changes in their HPMS data reporting gradually. As a result, the impact of the census-based changes on these statistics is not confined to a single year. Second, greater focus has been placed on Federal agencies to provide a more complete reporting of federally-owned mileage.
Exhibit 1-10: Highway Route Miles by Functional System, 2004–2014
| Functional System | 2004 | 2006 | 2008 | 2010 | 2012 | 2014 | Annual Rate of Change 2014/2004 |
|---|---|---|---|---|---|---|---|
| Rural Areas (less than 5,000 in population) | |||||||
| Interstate | 31,477 | 30,615 | 30,227 | 30,260 | 30,564 | 29,095 | -0.8% |
| Other Freeway & Expressway1 | 3,299 | 4,395 | 3,299 | ||||
| Other Principal Arterial1 | 92,131 | 91,462 | 92,131 | ||||
| Other Principal Arterial1 | 95,998 | 95,009 | 95,002 | -0.1% | |||
| Minor Arterial | 135,683 | 135,589 | 135,256 | 135,681 | 135,328 | 132,672 | -0.2% |
| Major Collector | 420,293 | 419,289 | 418,473 | 418,848 | 419,353 | 418,848 | 0.0% |
| Minor Collector | 268,088 | 262,966 | 262,852 | 263,271 | 262,435 | 263,271 | -0.2% |
| Local | 2,051,902 | 2,046,796 | 2,038,517 | 2,036,990 | 2,039,276 | 2,036,990 | -0.1% |
| Subtotal Rural Areas | 3,003,441 | 2,990,264 | 2,980,327 | 2,980,480 | 2,982,813 | 2,980,480 | -0.1% |
| Urban Areas (5,000 or more in population) | |||||||
| Interstate | 15,359 | 16,277 | 16,789 | 16,922 | 17,150 | 18,567 | 1.9% |
| Other Freeway and Expressway | 10,305 | 10,817 | 11,401 | 11,371 | 11,521 | 11,784 | 1.3% |
| Other Principal Arterial | 60,088 | 63,180 | 64,948 | 65,505 | 65,593 | 66,761 | 1.1% |
| Minor Arterial | 98,447 | 103,678 | 107,182 | 108,375 | 109,337 | 112,228 | 1.3% |
| Collector1 | 103,387 | 109,639 | 115,087 | 3.0% | |||
| Major Collector1 | 115,538 | 116,943 | 127,809 | ||||
| Minor Collector1 | 3,303 | 3,588 | 11,754 | ||||
| Local | 706,436 | 738,156 | 763,618 | 782,273 | 802,473 | 852,755 | 0.8% |
| Subtotal Urban Areas | 994,021 | 1,041,747 | 1,079,025 | 1,103,288 | 1,126,605 | 1,201,720 | 0.8% |
| Total Highway Route Miles | 3,997,462 | 4,032,011 | 4,059,352 | 4,083,768 | 4,109,418 | 4,177,074 | 0.2% |
1 Starting in 2010, the HPMS data reflect revised functional classifications. Rural Other Freeway and Expressway has been split from the rural Other Principal Arterial category, and urban Collector has been split into urban Major Collector and urban Minor Collector. The annual rate of change was computed based on the older combined categories.
Source: Highway Performance Monitoring System.
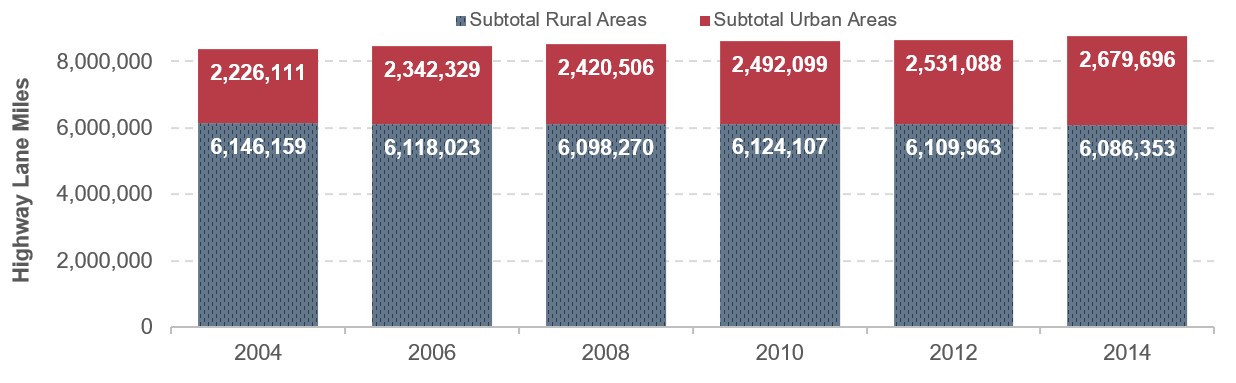
Exhibit 1-11 shows the change in highway lane miles from 2004 to 2014 by functional class and shows the changes in rural areas versus urban areas of the Nation. Urban areas have seen an increase in lane miles from more than 2.2 million in 2004 to slightly less than 2.7 million in 2014. The largest decrease in lane miles occurred on rural major collectors, a loss of 21,904 lane miles of roadway, while urban local roadways experienced the largest increase in lane miles, at 292,638 lane miles.
Exhibit 1-11: Highway Lane Miles by Functional System, 2004–2014
| Functional System | Highway Lane Miles | Annual Rate of Change 2014/2004 |
|||||
|---|---|---|---|---|---|---|---|
| 2004 | 2006 | 2008 | 2010 | 2012 | 2014 | ||
| Rural Areas (less than 5,000 in population) | |||||||
| Interstate | 128,012 | 124,506 | 122,956 | 123,762 | 124,927 | 118,688 | -0.8% |
| Other Freeway and Expressway1 | 11,907 | 16,593 | 20,677 | ||||
| Other Principal Arterial1 | 243,065 | 240,639 | 233,985 | ||||
| Other Principal Arterial1 | 249,480 | 248,334 | 250,153 | 0.2% | |||
| Minor Arterial | 283,173 | 282,397 | 281,071 | 287,761 | 281,660 | 274,271 | -0.3% |
| Major Collector | 845,513 | 843,262 | 841,353 | 857,091 | 842,722 | 823,609 | -0.3% |
| Minor Collector | 536,177 | 525,932 | 525,705 | 526,540 | 524,870 | 517,026 | -0.4% |
| Local | 4,103,804 | 4,093,592 | 4,077,032 | 4,073,980 | 4,078,552 | 4,098,098 | -0.01% |
| Subtotal Rural Areas | 6,146,159 | 6,118,023 | 6,098,270 | 6,124,107 | 6,109,963 | 6,086,353 | -0.1% |
| Urban Areas (5,000 or more in population) | |||||||
| Interstate | 84,016 | 89,036 | 91,924 | 93,403 | 95,197 | 102,541 | 2.0% |
| Other Freeway and Expressway | 47,770 | 50,205 | 53,073 | 53,231 | 54,160 | 55,385 | 1.5% |
| Other Principal Arterial | 210,506 | 221,622 | 228,792 | 235,127 | 234,469 | 231,099 | 0.9% |
| Minor Arterial | 250,769 | 269,912 | 274,225 | 285,954 | 283,608 | 287,061 | 1.4% |
| Collector1 | 220,177 | 235,240 | 245,262 | 3.1% | |||
| Major Collector1 | 252,435 | 250,760 | 272,931 | ||||
| Minor Collector1 | 7,404 | 7,948 | 25,168 | ||||
| Local | 1,412,872 | 1,476,314 | 1,527,230 | 1,564,546 | 1,604,946 | 1,705,510 | 1.9% |
| Subtotal Urban Areas | 2,226,111 | 2,342,329 | 2,420,506 | 2,492,099 | 2,531,088 | 2,679,696 | 1.9% |
| Total Highway Lane Miles | 8,372,270 | 8,460,352 | 8,518,776 | 8,616,206 | 8,641,051 | 8,766,049 | 0.5% |
1 Starting in 2010, the HPMS data reflect revised functional classifications. Rural Other Freeway and Expressway has been split from the rural Other Principal Arterial category, and urban Collector has been split into urban Major Collector and urban Minor Collector. The annual rate of change was computed based on the older combined categories.
Source: Highway Performance Monitoring System.
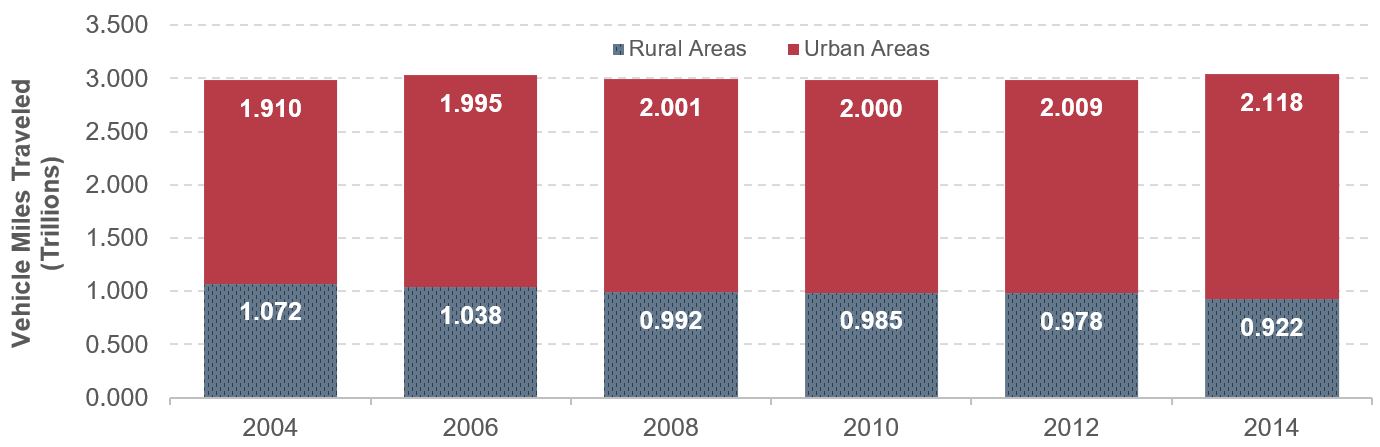
Exhibit 1-12 shows VMT in trillions of miles by functional class from 2004 to 2014. VMT in rural areas decreased from 1.07 trillion miles in 2004 to 0.92 trillion miles in 2014. Urban VMT increased from 1.91 trillion to slightly less than 2.12 trillion during the same period. Exhibit 1-12 also shows the largest average annual decrease of 2.3 percent was on rural major collectors and the largest gain was on the combined functional classifications of urban major and minor collectors, an increase of 2.3 percent. Overall, VMT on rural roadways declined by 1.5 percent and VMT on urban roadways increased by 1.0 percent between 2004 and 2014.
Exhibit 1-12: Vehicle Miles Traveled by Functional System and Area, 2004–2014
| Functional System | Annual Travel Distance (Trillions of Miles) | Annual Rate of Change 2014/2004 |
|||||
|---|---|---|---|---|---|---|---|
| 2004 | 2006 | 2008 | 2010 | 2012 | 2014 | ||
| Rural Areas (less than 5,000 in population) | |||||||
| Interstate | 0.267 | 0.258 | 0.244 | 0.246 | 0.246 | 0.232 | -1.4% |
| Other Freeway & Expressway1 | 0.020 | 0.020 | 0.026 | ||||
| Other Principal Arterial1 | 0.206 | 0.203 | 0.188 | ||||
| Other Principal Arterial1 | 0.241 | 0.232 | 0.223 | -1.2% | |||
| Minor Arterial | 0.169 | 0.163 | 0.152 | 0.151 | 0.149 | 0.141 | -1.8% |
| Major Collector | 0.201 | 0.193 | 0.186 | 0.176 | 0.176 | 0.159 | -2.3% |
| Minor Collector | 0.060 | 0.058 | 0.055 | 0.053 | 0.053 | 0.050 | -1.9% |
| Local | 0.132 | 0.133 | 0.132 | 0.133 | 0.130 | 0.126 | -0.5% |
| Subtotal Rural Areas | 1.072 | 1.038 | 0.992 | 0.985 | 0.978 | 0.922 | -1.5% |
| Urban Areas (5,000 or more in population) | |||||||
| Interstate | 0.460 | 0.483 | 0.482 | 0.483 | 0.490 | 0.525 | 1.3% |
| Other Freeway and Expressway | 0.209 | 0.218 | 0.224 | 0.222 | 0.225 | 0.228 | 0.9% |
| Other Principal Arterial | 0.454 | 0.470 | 0.466 | 0.461 | 0.460 | 0.471 | 0.4% |
| Minor Arterial | 0.366 | 0.380 | 0.381 | 0.378 | 0.375 | 0.393 | 0.7% |
| Collector1 | 0.164 | 0.176 | 0.178 | 2.3% | |||
| Major Collector1 | 0.179 | 0.177 | 0.195 | ||||
| Minor Collector1 | 0.004 | 0.004 | 0.012 | ||||
| Local | 0.258 | 0.268 | 0.271 | 0.273 | 0.278 | 0.295 | 1.4% |
| Subtotal Urban Areas | 1.910 | 1.995 | 2.001 | 2.000 | 2.009 | 2.118 | 1.0% |
| Total VMT | 2.982 | 3.034 | 2.993 | 2.985 | 2.987 | 3.040 | 0.2% |
1 Starting in 2010, the HPMS data reflect revised functional classifications. Rural Other Freeway and Expressway has been split from the rural Other Principal Arterial category, and urban Collector has been split into urban Major Collector and urban Minor Collector. The annual rate of change was computed based on the older combined categories.
Source: Highway Performance Monitoring System.
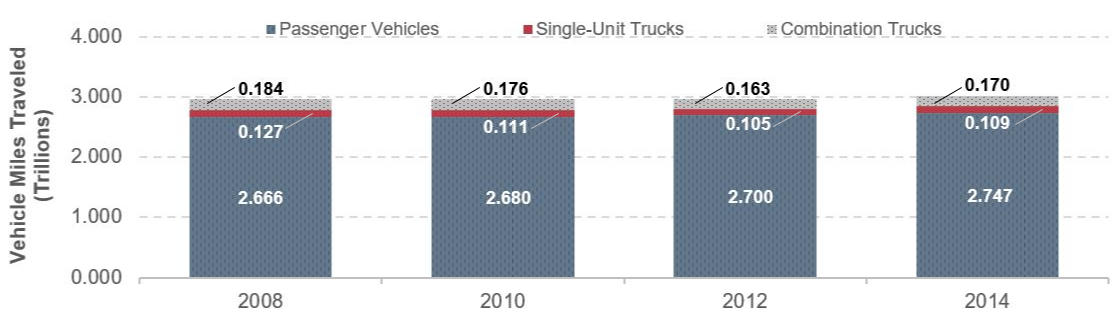
Exhibit 1-13 shows an analysis of the types of vehicles comprising the Nation’s VMT between 2008 and 2014. Three groups of vehicles are identified: passenger vehicles, which include motorcycles, buses, and light trucks (two-axle, four-tire models); single-unit trucks having six or more tires; and combination trucks, including those with trailers and semitrailers. Passenger vehicle travel accounted for 90.8 percent of total VMT in 2014; combination trucks accounted for 5.6 percent, and single-unit trucks accounted for 3.6 percent.
Passenger vehicle travel grew at an average annual rate of 0.5 percent from 2008 to 2014. During the same period, combination truck traffic declined at an average annual rate of 1.3 percent and single-unit truck traffic declined at an average annual rate of 2.5 percent. Household travel is discussed in more detail in Chapter 3; highway freight transportation is discussed in Part III.
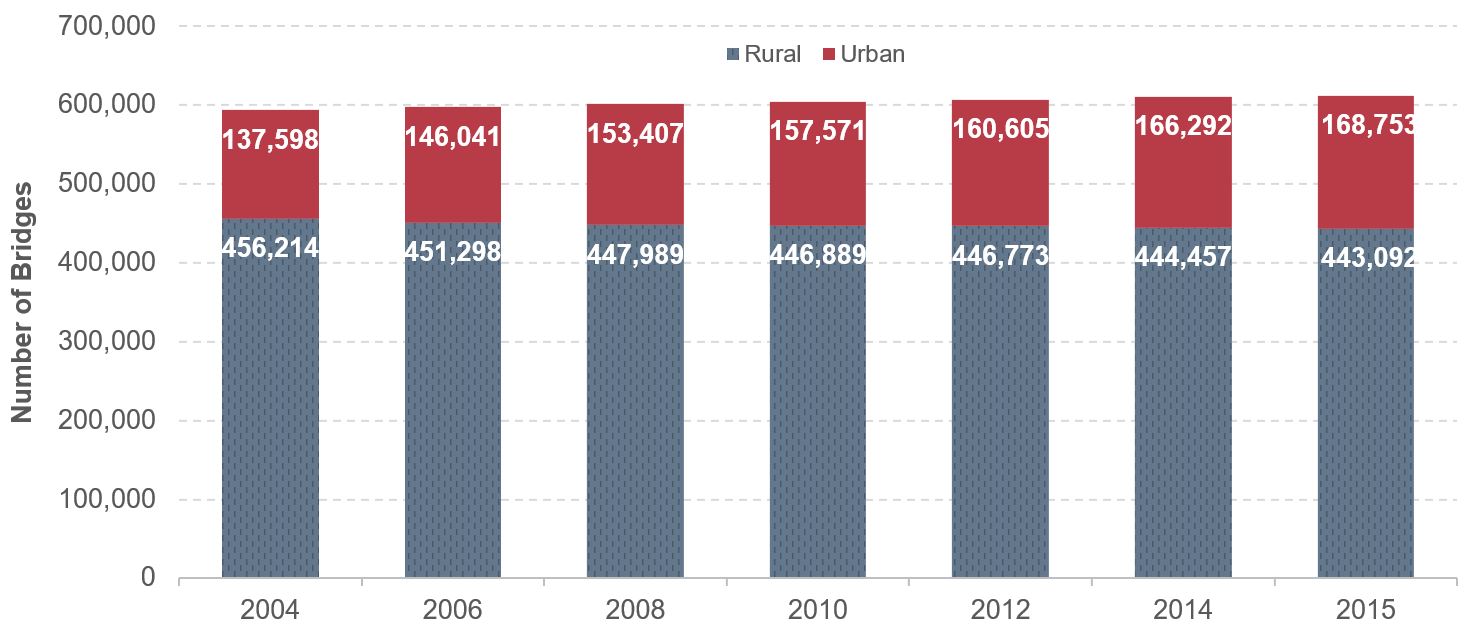
The change in the number of bridges by functional system from 2004 to 2014 is shown in Exhibit 1-14. The number of bridges in the Nation has increased from 594,100 in 2004 to 610,749 in 2014, an annual rate of change of approximately 0.3 percent. From 2014 to 2015 the number of bridges increased to 611,845. Rural Interstate bridges decreased at an annual rate of 1.0 percent from 2004 to 2014, while the number of bridges on urban collectors had the largest average annual increase at 3.5 percent.
The number of bridges on rural local roadways decreased by the largest amount, from 208,641 bridges in 2004 to 203,995 in 2014. During the same period the number of bridges increased by the largest amount—6,286 bridges—on urban collector roadways.
Exhibit 1-13: Highway Travel by Functional System and Vehicle Type, 2008–20141,2
| Functional System Vehicle Type | Annual Travel Distance (Trillions of Miles) | Annual Rate of Change 2014/2008 |
|||
|---|---|---|---|---|---|
| 2008 | 2010 | 2012 | 2014 | ||
| Rural | |||||
| Interstate | |||||
| Passenger Vehicles | 0.181 | 0.185 | 0.188 | 0.175 | -0.6% |
| Single-Unit Trucks | 0.012 | 0.011 | 0.009 | 0.009 | -4.2% |
| Combination Trucks | 0.050 | 0.049 | 0.049 | 0.047 | -1.1% |
| Other Arterial | |||||
| Passenger Vehicles | 0.322 | 0.324 | 0.325 | 0.309 | -0.7% |
| Single-Unit Trucks | 0.020 | 0.019 | 0.017 | 0.016 | -3.5% |
| Combination Trucks | 0.032 | 0.033 | 0.030 | 0.029 | -1.3% |
| Other Rural | |||||
| Passenger Vehicles | 0.335 | 0.328 | 0.327 | 0.304 | -1.6% |
| Single-Unit Trucks | 0.019 | 0.018 | 0.018 | 0.017 | -2.0% |
| Combination Trucks | 0.016 | 0.016 | 0.014 | 0.013 | -3.2% |
| Total Rural | |||||
| Passenger Vehicles | 0.839 | 0.837 | 0.840 | 0.789 | -1.0% |
| Single-Unit Trucks | 0.051 | 0.048 | 0.044 | 0.043 | -3.1% |
| Combination Trucks | 0.098 | 0.099 | 0.093 | 0.089 | -1.5% |
| Urban | |||||
| Interstate | |||||
| Passenger Vehicles | 0.424 | 0.427 | 0.434 | 0.463 | 1.5% |
| Single-Unit Trucks | 0.017 | 0.014 | 0.015 | 0.016 | -0.3% |
| Combination Trucks | 0.036 | 0.036 | 0.036 | 0.041 | 2.3% |
| Other Urban | |||||
| Passenger Vehicles | 1.403 | 1.415 | 1.427 | 1.495 | 1.1% |
| Single-Unit Trucks | 0.059 | 0.048 | 0.046 | 0.050 | -2.6% |
| Combination Trucks | 0.050 | 0.042 | 0.035 | 0.039 | -3.9% |
| Total Urban | |||||
| Passenger Vehicles | 1.827 | 1.842 | 1.861 | 1.958 | 1.2% |
| Single-Unit Trucks | 0.075 | 0.062 | 0.061 | 0.067 | -2.0% |
| Combination Trucks | 0.086 | 0.077 | 0.071 | 0.080 | -1.1% |
| Total | |||||
| Passenger Vehicles | 2.666 | 2.680 | 2.700 | 2.747 | 0.5% |
| Single-Unit Trucks | 0.127 | 0.111 | 0.105 | 0.109 | -2.5% |
| Combination Trucks | 0.184 | 0.176 | 0.163 | 0.170 | -1.3% |
1 Data do not include Puerto Rico.
2 The procedures used to develop estimates of travel by vehicle type have been significantly revised; the data available do not support direct comparisons prior to 2007.
Source: Highway Statistics, various years, Table VM-1.
Exhibit 1-14: Number of Bridges by Functional System and Area, 2004–2015
| Functional System | 2004 | 2006 | 2008 | 2010 | 2012 | 2014 | Annual Rate of Change 2014/2004 |
2015 |
|---|---|---|---|---|---|---|---|---|
| Rural | ||||||||
| Interstate | 27,648 | 26,633 | 25,997 | 25,223 | 25,201 | 25,057 | -1.0% | 25,024 |
| Other Principal Arterial | 36,258 | 35,766 | 35,594 | 36,084 | 36,460 | 36,711 | 0.1% | 36,619 |
| Minor Arterial | 40,197 | 39,521 | 39,079 | 39,048 | 39,123 | 38,159 | -0.5% | 38,084 |
| Major Collector | 94,079 | 93,609 | 93,118 | 93,059 | 92,875 | 92,777 | -0.1% | 92,547 |
| Minor Collector | 49,391 | 48,639 | 48,242 | 47,866 | 47,922 | 47,758 | -0.3% | 47,649 |
| Local | 208,641 | 207,130 | 205,959 | 205,609 | 205,192 | 203,995 | -0.2% | 203,169 |
| Subtotal Rural | 456,214 | 451,298 | 447,989 | 446,889 | 446,773 | 444,457 | -0.3% | 443,092 |
| Urban | ||||||||
| Interstate | 27,667 | 28,637 | 29,629 | 30,116 | 30,758 | 31,496 | 1.3% | 31,859 |
| Other Freeway and Expressway | 17,112 | 17,988 | 19,168 | 19,791 | 20,139 | 20,821 | 2.0% | 20,522 |
| Other Principal Arterial | 24,529 | 26,051 | 26,934 | 27,373 | 28,141 | 28,669 | 1.6% | 29,090 |
| Minor Arterial | 24,802 | 26,239 | 27,561 | 28,103 | 28,437 | 29,943 | 1.9% | 30,646 |
| Collectors | 15,548 | 17,618 | 18,932 | 20,311 | 20,590 | 21,834 | 3.5% | 22,355 |
| Local | 27,940 | 29,508 | 31,183 | 31,877 | 32,540 | 33,529 | 1.8% | 34,281 |
| Subtotal Urban | 137,598 | 146,041 | 153,407 | 157,571 | 160,605 | 166,292 | 1.9% | 168,753 |
| Unclassified | 288 | 222 | 110 | 33 | 2 | 0 | -100.0% | 0 |
| Total | 594,100 | 597,561 | 601,506 | 604,493 | 607,380 | 610,749 | 0.3% | 611,845 |
Source: National Bridge Inventory.
Key Takeaways
- Agencies/Reporters
- Most transit systems in the United States report to the National Transit Database (NTD). In 2014, 845 agencies serving almost all 497 urbanized areas and over 1,600 rural agencies reported to the NTD.
- In addition, more than 4,000 nonprofit providers operate in rural and urban areas.
- Modal Service
- Transit is provided through 18 distinct modes, which belong to two major categories: rail and nonrail. There were 1,073 regular fixed-route bus systems, 183 commuter bus systems, and 11 bus rapid transit systems in 2014.
- Demand-response service was provided by 724 systems in urban areas, and 1,134 systems in rural areas.
- Open-to-the-public vanpool service was provided by 98 systems.
- Other modes included ferryboat (29 systems), trolleybus (5 systems), and other less common modes.
- Rail modes included heavy rail (15 systems), light rail (22 systems), streetcar (11 systems), hybrid rail (5 systems), commuter rail (29 systems), and other less common rail modes that run on fixed tracks.
- Assets
- Agencies reported 204,800 vehicles in urban and rural areas.
- Rail systems were operated on 12,794 miles of track.
- Fixed-route bus, commuter bus, and bus rapid transit systems operated in over 233,000 mixed-traffic route miles.
- Agencies reported 3,281 passenger stations and 1,720 maintenance facilities.
Transit System Assets
System History
The first transit systems in the United States date to the 19th century. These systems were privately owned, for-profit businesses that were instrumental in defining the urban communities of that time. By the postwar period, competition from the private automobile was limiting the ability of transit businesses to operate at a profit. As transit businesses started to fail, local, State, and national government leaders began to realize the importance of sustaining transit services. In 1964, Congress passed the Urban Mass Transportation Act of 1964, established a program to provide Federal funding for transit systems. The Act changed the character of the industry by specifying that Federal funds for transit be given to public agencies rather than private firms; this funding shift accelerated the transition from private to public ownership and operation of transit systems. The Act also required local governments to contribute matching funds as a condition for receiving Federal aid for transit services—setting the stage for the multilevel governmental partnerships that characterize today’s transit industry.
State government involvement in the provision of transit services is usually through financial support and performance oversight. Some States, however, have undertaken outright ownership of transit services. Connecticut, Delaware, Georgia, Louisiana, Maryland, Massachusetts, Washington, the U.S. Virgin Islands, and Puerto Rico directly own and operate transit systems. New Jersey and Rhode Island have both set up statewide public transit corporations to operate transit services within their States.
Federal legislation in 1962 instituted the first requirement for transportation planning in urban areas of more than 50,000 population, but did not require the establishment of metropolitan planning organizations (MPOs).
MPOs are composed of State and local officials who work to address transportation planning needs of urbanized areas at a regional level. Twenty-nine years later, the Intermodal Surface Transportation Efficiency Act of 1991 (ISTEA) made MPO coordination a prerequisite for Federal funding of many transit projects.
In addition, ISTEA made several other changes to transportation law, including changing the name of the Urban Mass Transportation Administration to the Federal Transit Administration (FTA). On the urban side, ISTEA increased transit formula grant funding to all agencies and initiated the use of a formula to allocate capital funds, rather than determine funding allocation on a discretionary project basis. The Act also increased flexibility in using highway trust funds between transit and highway projects.
The Transportation Equity Act for the 21st Century (TEA-21) was passed in 1998 and over the next 6 years increased transit funding by 70 percent. Part of this additional funding was to offset the increased cost of implementing service for persons with disabilities under the Americans with Disabilities Act of 1990 (ADA). The ADA required public transit services to be open to the public without discrimination and to meet all other requirements of the Act. The ADA also further increased flexibility in the use of Federal funds.
The Safe, Accountable, Flexible, Efficient Transportation Equity Act: A Legacy for Users (SAFETEA-LU) was enacted in 2005. This Act created some new programs—especially for smaller transit providers—and new program definitions. Within the urban formula program, a new formula allocation was added for Small Transit Intensive Cities (STIC). In the Capital Investment Grants (CIG) program, a Small Starts project eligibility was created with streamlined review process for lower-cost alternative approaches to transit projects such as bus rapid transit. In the rural (other than urbanized area) program, funding was increased greatly for rural transit providers, intercity fixed-route bus transportation became eligible for rural funds, and funds were made available for Native American Tribal transit. SAFETEA-LU extension acts were continued until July 2012.The Moving Ahead for Progress in the 21st Century (MAP-21) Act was enacted into law on July 6, 2012. MAP-21 consolidated the Jobs Access and Reverse Commute (JARC) program into the core formula program and added the number of low-income individuals as a new formula factor. Funds for the rural program are to be allocated based on a new service factor—vehicle revenue miles—and a factor for low-income individuals. The Act gave FTA safety oversight authority and directed FTA to issue a new rule requiring transit asset management to promote a state of good repair (SGR). Funds for Tribal transit were increased, and some funds were distributed by a new formula based in part on vehicle revenue miles. Another significant change was the elimination of the Fixed-Guideway Modernization capital program and the creation of the new, formula-based SGR program in its place. The SGR program would dedicate capital funds to the repair, upgrading, and modernization of the Nation’s transit fixed-guideway infrastructure. This fixed-guideway infrastructure would include the rail transit systems, high-intensity motor bus systems operating on HOV (high occupancy vehicle) lanes, ferries, and bus rapid transit systems. The Act requires transit agencies to develop a transit asset management plan that inventories their capital assets and evaluates the condition of those assets.
The Fixing America’s Surface Transportation (FAST) Act (Pub. L. No. 114-94) was enacted into law on December 4, 2015, covering Fiscal Years 2016 through 2020. The FAST Act retained the basic structure of the urban formula program, but increased the STIC formula funding and allowed certain smaller systems (100 demand response vehicles or fewer) in large urban areas to use some formula funds for operating expense.
System Infrastructure
Urban and Rural Transit Agencies
State and local transit agencies have evolved into several different institutional models. A transit provider can be a unit of a regional transportation agency operated directly by the State, county, or city government, or an independent agency with an elected or appointed board of governors. Transit operators can provide service directly with their own equipment or they can purchase transit services through an agreement with a contractor.
As summarized in Exhibit 1-15, in 2014, approximately 845 transit providers in urbanized areas (UZAs) and 1,684 transit providers in rural areas submitted data to the National Transit Database (NTD). Exhibit 1-16 identifies the population and unlinked transit trips for individual urbanized areas with a population over 1 million, as some exhibits in this report present data on areas over and under 1 million in population.
Of the 845 urban reporters, 281 were independent public authorities or agencies; 428 were city, county, or local government transportation units or departments; 20 were State government unit or Departments of Transportation; and 67 were private operators. The remaining 49 agencies were either private operators or independent agencies, such as MPOs, Councils of Governments (COGs), or other planning agencies, universities, and Indian Tribes.
Exhibit 1-15: Number of Urban and Rural Agencies by Organizational Structure
| Organization Structure | City, County, Local Government Transportation Units or Departments | Independent Public Authorities or Agencies | State Government Unit or Departments of Transportation | Private Operators or Independent Agencies1 | Other2 | Total |
|---|---|---|---|---|---|---|
| Urban Agencies | 428 | 281 | 20 | 67 | 49 | 845 |
| Consolidated Urban Reporters | 4 | 4 | ||||
| Net Number of Urban Reporters | 428 | 281 | 20 | 67 | 53 | 849 |
| Rural Agencies | 743 | 321 | 4 | 377 | 239 | 1684 |
| Total | 1171 | 602 | 24 | 444 | 292 | 2533 |
1Private provider reporting on behalf of a public entity, private-for-profit corporation, or private-non-profit corporation.
2Other includes “Area Agency on Aging,” “MPO or COG or other planning agencies,” “Other,” “Tribe,” and “University.”
Source: National Transit Database.
Similarly, of the 1,684 rural reporters, 321 were independent public authorities or agencies; 743 were city, county, or local government transportation units or departments; 4 were State government unit or Departments of Transportation; and 377 were private operators. The remaining 239 agencies were either private operators or independent agencies (e.g., MPOs, COGs, or other planning agencies, universities, and Indian Tribes).
All transit providers that receive either urban formula or rural formula funds from FTA must report to the NTD. In the past, small systems operating fewer than nine vehicles could request a reporting exemption; now all small systems are required to submit a simplified report to the NTD each year, but the report requirements parallel those of rural providers. This small-system reporting waiver was granted to 288 agencies with fewer than 30 vehicles in maximum service and not operating fixed-guideway service.
Some transit providers only receive funds from the Section 5310 program. This program (49 U.S.C. 5310) provides formula funding to States for the purpose of assisting private nonprofit groups in meeting the transportation needs of older adults and people with disabilities when the transportation service provided is unavailable, insufficient, or inappropriate to meeting these needs.
Of the 532 agencies that reported providing service on 1,196 separate modal networks, 409 operated more than one mode. In 2014, an additional 1,342 transit operators were serving rural areas. Some agencies that do not have a reporting requirement to the NTD still choose to submit a report because doing so can help their region receive additional Federal transit funding.
NTD includes urban data reported by mode and type of service (directly operated and purchased transportation). As of December 2010, NTD contained data for 16 modes. Beginning in January 2011, new modes were added to the NTD urban data, including:
- streetcar rail—previously reported as light rail,
- hybrid rail—previously reported as light rail or commuter rail,
- commuter bus—previously reported as motorbus,
- bus rapid transit—previously reported as motorbus, and
- demand-response taxi—previously reported as demand-response.
Data from NTD are presented for each new mode for analyses specific to 2014. For NTD time series analysis, however, streetcar rail and hybrid rail are included as light rail, commuter bus and bus rapid transit as fixed-route bus, and demand response-taxi as demand-response.
Exhibit 1-16: Urbanized Areas (UZA) with Population over 1 Million in Census 2010
| UZA Rank | UZA Name | 2010 Population (Millions) | 2014 Unlinked Transit Trips (in Millions) |
|---|---|---|---|
| 1 | New York-Newark, NY-NJ-CT | 18.4 | 4,274 |
| 2 | Los Angeles-Long Beach-Anaheim, CA | 12.2 | 681 |
| 3 | Chicago, IL-IN | 8.6 | 630 |
| 4 | Miami, FL | 5.5 | 169 |
| 5 | Philadelphia, PA-NJ-DE-MD | 5.4 | 392 |
| 6 | Dallas-Fort Worth-Arlington, TX | 5.1 | 80 |
| 7 | Houston, TX | 4.9 | 86 |
| 8 | Washington, DC-VA-MD | 4.6 | 480 |
| 9 | Atlanta, GA | 4.5 | 137 |
| 10 | Boston, MA-NH-RI | 4.2 | 419 |
| 11 | Detroit, MI | 3.7 | 38 |
| 12 | Phoenix-Mesa, AZ | 3.6 | 75 |
| 13 | San Francisco-Oakland, CA | 3.3 | 416 |
| 14 | Seattle, WA | 3.1 | 201 |
| 15 | San Diego, CA | 3.0 | 109 |
| 16 | Minneapolis-St. Paul, MN-WI | 2.7 | 98 |
| 17 | Tampa-St. Petersburg, FL | 2.4 | 31 |
| 18 | Denver-Aurora, CO | 2.4 | 96 |
| 19 | Baltimore, MD | 2.2 | 106 |
| 20 | St. Louis, MO-IL | 2.2 | 51 |
| 21 | San Juan, PR | 2.1 | 44 |
| 22 | Riverside-San Bernardino, CA | 1.9 | 21 |
| 23 | Portland, OR-WA | 1.8 | 112 |
| 24 | Cleveland, OH | 1.8 | 51 |
| 25 | San Antonio, TX | 1.8 | 44 |
| 26 | Pittsburgh, PA | 1.7 | 66 |
| 27 | Sacramento, CA | 1.7 | 30 |
| 28 | San Jose, CA | 1.7 | 51 |
| 29 | Cincinnati, OH-KY-IN | 1.6 | 21 |
| 30 | Kansas City, MO-KS | 1.5 | 17 |
| 31 | Orlando, FL | 1.5 | 25 |
| 32 | Indianapolis, IN | 1.5 | 11 |
| 33 | Virginia Beach, VA | 1.4 | 18 |
| 34 | Milwaukee, WI | 1.4 | 43 |
| 35 | Austin, TX | 1.4 | 34 |
| 36 | Columbus, OH | 1.4 | 20 |
| 37 | Austin, TX | 1.4 | 34 |
| 38 | Charlotte, NC-SC | 1.2 | 30 |
| 39 | Providence, RI-MA | 1.2 | 22 |
| 40 | Jacksonville, FL | 1.1 | 13 |
| 41 | Memphis, TN-MS-AR | 1.1 | 9 |
| 42 | Salt Lake City-West Valley City, UT | 1.0 | 34 |
| Total | 135.1 | 9,317 | |
Source: U.S. Department of Commerce, Census Bureau.
The Nation’s fixed-route bus and demand-response systems are much more extensive than the rail transit system. Bus fixed-route service includes three distinct modes: regular fixed-route bus, commuter bus, and bus rapid transit.
As summarized in Exhibit 1-17, in 2014, 1,267 agencies reported fixed-route bus service, including 1,073 regular bus systems, 183 commuter bus systems, and 11 bus rapid transit systems. Some agencies operate more than one type of fixed-route bus, and so the sum of the three types does not equal the number of agencies operating these systems.
Transit agencies reported 1,858 demand-response systems (including demand-response taxi), 15 heavy rail systems, 29 commuter rail systems, 5 hybrid rail systems, 22 light rail systems, and 11 streetcar systems (some of which are not yet in service). Hybrid rail systems primarily operate routes on the national system of railroads but do not operate with the characteristics of commuter rail. This service typically operates light rail-type vehicles as diesel multiple-unit trains (DMUs).
In some urban areas one consolidated entity provides paratransit services that are required by Federal law, even though multiple transit agencies serve that region. This is why the number of fixed-route systems is greater than the number of demand response systems.
Although every major urbanized area (population over 1 million) in the United States has fixed-route bus and demand-response systems, 48 urbanized areas were served by at least one of the rail modes, including 20 by commuter rail, 22 by light rail, 12 by heavy rail, 9 by streetcar vehicles, 5 by hybrid rail vehicle, and 11 by the other rail modes. Exhibit 1-18 depicts the number of passenger car revenue miles for each rail mode by urbanized area.
In addition to fixed-route bus systems, demand-response systems, and rail modes, 84 publicly operated transit vanpool systems, 22 ferryboat systems, 5 trolleybus systems, 7 monorail/automated guideway systems, 3 inclined plane systems, 1 cable car system, 1 aerial tramway system, and 1 públicoii were operating in urbanized areas of the United States and its territories.
Exhibit 1-17: Number of Systems by Mode
| Mode Type | Urban | Rural | Total |
|---|---|---|---|
| Non-Rail | |||
| Regular Bus | 651 | 422 | 1,073 |
| Commuter Bus | 111 | 72 | 183 |
| Bus Rapid Transit (BRT) | 10 | 1 | 11 |
| Demand-Response/Taxi | 724 | 1,134 | 1,858 |
| Vanpool | 77 | 21 | 98 |
| Ferryboat | 22 | 7 | 29 |
| Trolleybus | 5 | 0 | 5 |
| Rail | |||
| Heavy Rail | 15 | 0 | 15 |
| Light Rail | 22 | 0 | 22 |
| Streetcar1 | 11 | 0 | 11 |
| Commuter Rail | 24 | 0 | 24 |
| Hybrid Rail | 5 | 0 | 5 |
| Monorail/Automated Guideway | 6 | 0 | 6 |
| Inclined Plane | 3 | 0 | 3 |
| Other Rail2 | 4 | 0 | 4 |
| Total | 1,686 | 1,657 | 3,343 |
1Excludes the Galveston, Texas, streetcar, which has been out of service since Hurricane Ike in 2008 but is intended to be restarted. Galveston was designated an urbanized area in the 2000 Census, but did not meet the 50,000-person threshold in the 2010 Census.
2Other Rail include Alaska Railroad, Cable Car, and Inclined Plane.
Source: National Transit Database.
Exhibit 1-18: Vehicle Revenue Miles for Rail Modes Serving Urbanized Areas, 20141
| UZA Rank | Urbanized Area | Commuter Rail | Heavy Rail | Light Rail | Streetcar | Hybrid Rail | Other2 | Total Rail |
|---|---|---|---|---|---|---|---|---|
| 1 | New York-Newark, NY-NJ-CT | 197,549,135 | 360,853,386 | 2,484,796 | 1,270,176 | 562,157,493 | ||
| 2 | Los Angeles-Long Beach-Anaheim, CA | 13,214,358 | 7,067,079 | 13,863,381 | 34,144,818 | |||
| 3 | Chicago, IL-IN | 46,881,199 | 70,679,582 | 117,560,781 | ||||
| 4 | Miami, FL | 3,422,858 | 7,976,759 | 1,332,110 | 12,731,727 | |||
| 5 | Philadelphia, PA-NJ-DE-MD | 22,734,769 | 21,112,329 | 3,449,801 | 47,296,899 | |||
| 6 | Dallas-Fort Worth-Arlington, TX | 1,152,028 | 9,206,750 | 65,959 | 10,424,737 | |||
| 7 | Houston, TX | 1,577,592 | 1,577,592 | |||||
| 8 | Washington, DC-VA-MD | 2,090,084 | 74,078,897 | 76,168,981 | ||||
| 9 | Atlanta, GA | 18,086,375 | 18,086,375 | |||||
| 10 | Boston, MA-NH-RI | 23,332,209 | 23,133,946 | 5,933,203 | 52,399,358 | |||
| 11 | Detroit, MI | 544,552 | 544,552 | |||||
| 12 | Phoenix-Mesa, AZ | 2,467,628 | 2,467,628 | |||||
| 13 | San Francisco-Oakland, CA | 6,775,525 | 64,766,101 | 4,710,732 | 553,800 | 291,853 | 77,098,011 | |
| 14 | Seattle, WA | 1,603,802 | 2,697,552 | 137,127 | 222,900 | 4,661,381 | ||
| 15 | San Diego, CA | 1,394,955 | 8,516,212 | 676,132 | 10,587,299 | |||
| 16 | Minneapolis-St. Paul, MN-WI | 528,744 | 4,005,704 | 4,534,448 | ||||
| 17 | Tampa-St. Petersburg, FL | 66,590 | 66,590 | |||||
| 18 | Denver-Aurora, CO | 11,158,766 | 11,158,766 | |||||
| 19 | Baltimore, MD | 5,863,504 | 5,072,282 | 3,102,717 | 14,038,503 | |||
| 20 | St. Louis, MO-IL | 6,243,285 | 6,243,285 | |||||
| 21 | San Juan, PR | 1,910,978 | 1,910,978 | |||||
| 23 | Las Vegas-Henderson, NV | 2,039,738 | 2,039,738 | |||||
| 24 | Portland, OR-WA | 7,723,744 | 350,284 | 163,404 | 8,237,432 | |||
| 25 | Cleveland, OH | 2,432,606 | 830,016 | 3,262,622 | ||||
| 27 | Pittsburgh, PA | 2,070,100 | 19,090 | 2,089,190 | ||||
| 28 | Sacramento, CA | 3,936,754 | 3,936,754 | |||||
| 29 | San Jose, CA | 3,391,181 | 3,391,181 | |||||
| 32 | Orlando, FL | 99,456 | 99,456 | |||||
| 34 | Virginia Beach, VA | 372,914 | 372,914 | |||||
| 37 | Austin, TX | 279,757 | 279,757 | |||||
| 38 | Charlotte, NC-SC | 946,240 | 946,240 | |||||
| 40 | Jacksonville, FL | 172,126 | 172,126 | |||||
| 41 | Memphis, TN-MS-AR | 209,574 | 209,574 | |||||
| 42 | Salt Lake City-West Valley City, UT | 5,332,805 | 6,429,332 | 11,762,137 | ||||
| 44 | Nashville-Davidson, TN | 199,870 | 199,870 | |||||
| 46 | Buffalo, NY | 909,413 | 909,413 | |||||
| 47 | Hartford, CT | 1,870,204 | 1,870,204 | |||||
| 49 | New Orleans, LA | 1,013,727 | 1,013,727 | |||||
| 56 | Albuquerque, NM | 1,383,665 | 1,383,665 | |||||
| 88 | Little Rock, AR | 54,748 | 54,748 | |||||
| 100 | Chattanooga, TN-GA | 17,347 | 17,347 | |||||
| 102 | Stockton, CA | 950,383 | 950,383 | |||||
| 104 | Denton-Lewisville, TX | 624,330 | 624,330 | |||||
| 177 | Portland, ME | 2,139,537 | 2,139,537 | |||||
| 256 | Kenosha, WI-IL | 17,247 | 17,247 | |||||
| 393 | Morgantown, WV | 740,955 | 740,955 | |||||
| 400 | Johnstown, PA | 3,063 | 3,063 |
1Based on primary UZA of the transit system. Some smaller urbanized areas are served by rail that is primary to a larger area.
2Other rail modes include cable car, inclined plane, and monorail/automated guideway.
Source: National Transit Database.
Transit Fleet and Stations
Exhibit 1-19 provides an overview of the Nation’s 204,800 transit vehicles in 2014 by type of vehicle and size of urbanized area. Although some types of vehicles are specific to certain modes, many vehicles—particularly small buses and vans—are used by several different transit modes. For example, vans are used to provide vanpool, demand-response, público, or fixed-route bus services.
Exhibit 1-20 shows the composition of the Nation’s urban and rural transit road vehicle fleet in 2014. More than one-third of these vehicles, or 37 percent, are full-sized motor buses. Additional information on trends in the number and condition of vehicles over time is included in Chapter 8. Vans, as presented here, are the familiar 10-seat passenger vans. Articulated buses are long vehicles articulated for better maneuverability on city streets. Full-sized buses are standard 40-foot, 40-seat city buses. Mid-sized buses are in the 30-foot, 30-seat range. Small buses, typically built on truck chassis, are shorter and seat around 25 people. Cutaways are typically built on van chassis, and on average have a seating capacity of 15 seats.
Whereas Exhibit 1-20 depicts fleet by vehicle type, Exhibit 1-21 depicts fleet by mode. Some modes can be composed of more than one vehicle type. The national fleet includes over 21,000 rail vehicles (passenger cars), and over 146,000 nonrail vehicles, excluding special service vehicles. The bus fleet, which includes bus, commuter bus, and bus rapid transit, accounts for 39 percent of the national fleet, and demand-response for 29 percent of the national fleet.
The size of the ADA fleet and stations are presented in Chapter 4.
Exhibit 1-19: Transit Active Fleet by Vehicle Type, 2014
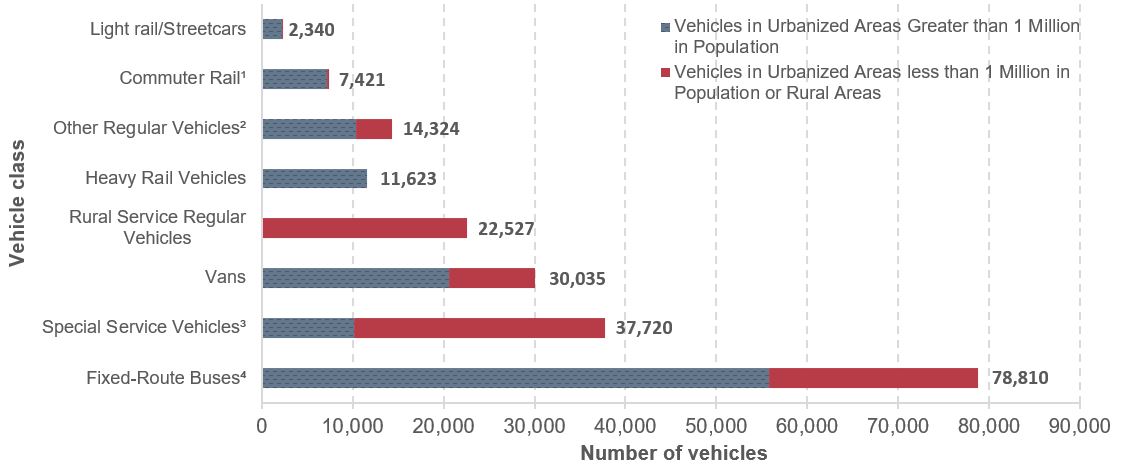
1Includes commuter rail locomotives, commuter rail passenger coaches, and commuter rail self-propelled passenger cars.
2Includes aerial tramway vehicles, automated guideway vehicles, automobiles, cable cars, cutaway, ferryboats, inclined plane vehicles, monorail vehicles, sport utility vehicles, trolleybuses, and vintage trolleys.
3Source for "Special Service Vehicles" is the FTA, Fiscal Year Trends Report on the Use of Section 5310 Elderly and Persons with Disabilities Program Funds, 2002.
4Includes articulated buses, buses, double decked buses, and over-the-road-buses.
Source: National Transit Database.
Exhibit 1-20: Composition of Transit Road Vehicle Fleet, 2014
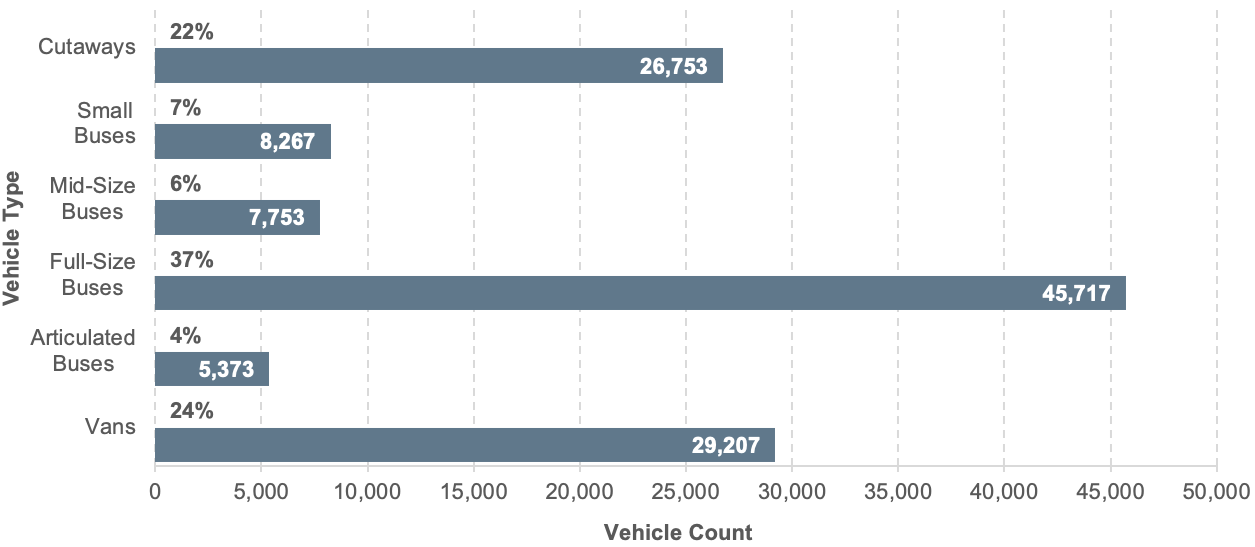
Note: There is not a one-to-one map between modes and vehicle types. For instance, cutaways are used for both fixed-route bus and demand response. In addition, TERM uses a different classification for vehicle types than does NTD.
Source: Transit Economic Requirements Model (TERM) and National Transit Database.
Exhibit 1-21: Stations and Fleet by Mode, 2014
| Transit Mode | Active Vehicles | Total Stations |
|---|---|---|
| Rail | ||
| Heavy Rail | 11,623 | 1,130 |
| Commuter Rail | 7,305 | 1,245 |
| Light Rail | 2,071 | 828 |
| Alaska Railroad | 95 | 11 |
| Monorail/Automated Guideway | 159 | 58 |
| Cable Car | 39 | 0 |
| Inclined Plane | 6 | 6 |
| Hybrid Rail | 55 | 55 |
| Streetcar Rail | 86 | 86 |
| Total Rail | 21,672 | 3,419 |
| Non-Rail | ||
| Bus | 65,592 | 1,476 |
| Demand Response | 49,398 | 0 |
| Vanpool | 15,071 | 0 |
| Ferryboat | 166 | 101 |
| Trolleybus | 544 | 5 |
| Público | 2,310 | 0 |
| Bus Rapid Transit | 496 | 27 |
| Commuter Bus | 5,979 | 234 |
| Demand-Response - Taxi | 7,092 | 0 |
| Aerial Tramway | 61 | 2 |
| Total Nonrail | 146,709 | 1,845 |
| Total All Modes | 168,381 | 5,264 |
1Source: National Transit Database.
Track and Maintenance Facilities
Exhibit 1-22 shows maintenance facility counts broken down by mode and by size of urbanized area for directly operated service. Modes such as hybrid rail, demand-response taxi, and público are not included because all such service is purchased. Chapter 6 includes data on the age and condition of these facilities.
A single facility can be used by more than one mode. In these cases, the count of facilities is prorated based on the number of peak vehicles for each mode.
As Exhibit 1-23 shows, transit rail providers (including other rail and tramway providers) operated 12,794 miles of track in 2014. The Nation’s rail system mileage is dominated by the longer distances generally covered by commuter rail. Light and heavy rail typically operate in more densely developed areas and have more stations per track mile.
Exhibit 1-22: Maintenance Facilities, 2014
| Maintenance Facility Type1 | Over 1 Million | Under 1 Million and Rural Areas | Total |
|---|---|---|---|
| Heavy Rail | 58 | 0 | 58 |
| Commuter Rail | 76 | 8 | 84 |
| Light Rail | 38 | 1 | 39 |
| Streetcar Rail | 11 | 4 | 15 |
| Other Rail2 | 6 | 5 | 11 |
| Fixed-Route Bus | 449 | 387 | 837 |
| Commuter Bus | 73 | 30 | 103 |
| Bus Rapid Transit | 2 | 1 | 4 |
| Demand Response | 255 | 266 | 521 |
| Vanpool | 17 | 7 | 23 |
| Ferryboat | 13 | 8 | 21 |
| Trolleybus | 4 | 1 | 5 |
| Rural Transit3 | 0 | 729 | 729 |
| Total Maintenance Facilities | 1,003 | 1,448 | 2,451 |
1Directly operated service only. Includes owned and leased facilities.
2Alaska railroad, automated guideway, cable car, inclined plane, and monorail.
3Vehicles owned by operators receiving funding from FTA as directed by 49 USC Section 5311. These funds are for transit services in areas with populations of less than 50,000. (Section 5311 Status of Rural Public Transportation 2000, Community Transportation Association of America, April 2001).
Source: National Transit Database.
Exhibit 1-23: Transit Rail Mileage and Stations, 2014
| Urbanized Area Track Mileage | |
|---|---|
| Heavy Rail | 2,274 |
| Commuter Rail | 7,760 |
| Light Rail | 1,529 |
| Hybrid Rail | 202 |
| Streetcar Rail | 301 |
| Other Rail and Tramway1 | 729 |
| Total Urbanized Area Track Mileage | 12,794 |
| Urbanized Area Transit Rail Stations Count | |
| Heavy Rail | 1,130 |
| Commuter Rail | 1,245 |
| Light Rail | 828 |
| Hybrid Rail | 55 |
| Streetcar Rail | 86 |
| Other Rail and Tramway1 | 77 |
| Total Urbanized Area Transit Rail Stations | 3,421 |
1Alaska railroad, automated guideway, cable car, inclined plane, monorail, and aerial tramway.
Source: National Transit Database.
i See https://www.fhwa.dot.gov/planning/national_highway_system/nhs_maps/map21estmileage.cfm. Figures adjusted to include Puerto Rico based on data from Highway Statistics 2011, Tables HM-41 and HM-20. [Return to Section]
ii A privately owned market-driven service using vans and small buses, comprising the largest transit system in Puerto Rico. [Return to Section]