

Chapter 11: Freight Transportation

Key Takeaways
- Freight transportation affects everyone.
- By the year 2045, the total value of freight in the United States is expected nearly to double that of 2012.
- Trucks move 64 percent of freight by ton and 69 percent of freight by value—by far the single largest mode.
- Intermodal Connectors provide the “last mile” linkage between freight facilities and the NHS.
- Since the year 2000, States have designated approximately 182 new freight intermodal connectors.
- The lack of safe truck parking in all States, and especially in and around large metropolitan areas, is a growing concern to truckers.
Freight is generally understood to be merchandise or commodities that are moved by a mode of transportation, such as a truck, ship, aircraft, pipeline, or train. Freight transportation is the physical process of transporting commodities or merchandise from one place to another for a fee.
Freight transportation affects every business and household in some way. The economy of the United States depends on freight transportation to connect businesses to markets throughout the world. Domestic manufacturers rely on the timely delivery of freight to meet production schedules. Wholesalers and retailers depend on a fast, reliable, and cost-effective transportation system. In the expanding world of e-commerce, households and small businesses depend on transportation to deliver freight directly to them. Service providers, public utilities, construction companies, and Government agencies rely on freight transportation to obtain needed equipment and supplies.
As the economy continues to grow in the coming decades, freight transportation demand is expected to increase. Projections released in March 2016 by the U.S. Department of Transportation’s (DOT’s) Bureau of Transportation Statistics (BTS) and FHWA show that freight tons moving on the Nation’s transportation system will grow by 40 percent in the next three decades, and the value of the freight will almost double.i
Freight System
The freight transportation system in the United States includes an extensive network of highways, railroads, waterways, pipelines, and airways: 958,000 miles of Federal-aid highways, 141,000 miles of railroads, 11,000 miles of inland waterways, and 1.6 million miles of pipelines. The United States has more than 19,000 airports and more than 5,000 coastal, Great Lakes, and inland waterway facilities. Freight moves to, from, and within the United States via this extensive network, sometimes using two or more modes along the supply chain, with trucks moving the largest share of freight by tonnage and value. By 2045, the total weight of freight on all modes of transportation is projected to reach 25 billion tons, whereas the value of freight is expected to grow to $37 trillion.ii
Exhibit 11-1 identifies the share of total tonnage and value moved by each freight transportation mode in the United States in 2015, broken out by origin and destination (import and export). The domestic movement of freight makes up 89 percent of the total weight of goods transported and 78 percent of the total value of goods transported.
Exhibit 11-1: Mode Share by Tonnage and Value, 2015
| Domestic Mode | Millions of Tons | Billions of 2015 USD1 | ||||||
|---|---|---|---|---|---|---|---|---|
| Domestic Only |
Export | Import | Total | Domestic Only |
Export | Import | Total | |
| Air (includes truck-air) | 0% | 0% | 0% | 0% | 1% | 17% | 14% | 4% |
| Multiple Modes & Mail | 2% | 5% | 3% | 2% | 12% | 6% | 6% | 11% |
| Other Modes and Unknown | 0% | 0% | 0% | 0% | 0% | 1% | 2% | 0% |
| Pipeline | 19% | 13% | 16% | 18% | 9% | 4% | 4% | 8% |
| Rail | 9% | 15% | 9% | 9% | 3% | 5% | 5% | 3% |
| Truck | 66% | 52% | 35% | 64% | 73% | 57% | 53% | 69% |
| Water | 4% | 15% | 11% | 5% | 3% | 10% | 9% | 4% |
| No Domestic Mode | 0% | 0% | 25% | 2% | 0% | 0% | 7% | 1% |
| Total | 16,045 | 912 | 1,099 | 18,056 | 15,558 | 1,745 | 2,567 | 19,871 |
1 USD = U.S. dollars.
Source: Bureau of Transportation Statistics and FHWA, Freight Analysis Framework, version 4, 2016.
Freight transportation movements are expected to increase over the next few decades, as global populations grow and consumer spending power increases. Exhibit 11-2 shows historical and forecasted mode share in ton-miles from 1990–2040. The data reveal that most freight transportation modes are expected to experience increased volumes, although the amount of expected growth will vary by mode, with pipelines projected to have negative growth to year 2040.
Exhibit 11-2: Historical and Forecasted Mode Share of Ton-miles, 1990–2040
| Domestic Mode | Ton-miles Mode Share | Average Annual Growth Rate (percent) | |||||||
|---|---|---|---|---|---|---|---|---|---|
| Historical | Forecast | ||||||||
| 1990 | 2000 | 2010 | 2015 | 2040 | 1990 to 2000 | 2000 to 2010 | 2010 to 2015 | 2015 to 2040 | |
| Truck | 36.4% | 42.3% | 44.0% | 46.5% | 54.4% | 3.2 | 1.0 | 3.0 | 1.6 |
| Railroad | 22.9% | 28.1% | 29.4% | 28.7% | 25.9% | 3.8 | 1.1 | 1.4 | 0.6 |
| Pipeline | 22.0% | 17.3% | 17.0% | 16.7% | 12.1% | -0.8 | 0.5 | 1.5 | -0.3 |
| Domestic Water Transportation | 17.9% | 11.5% | 8.8% | 7.4% | 6.8% | -2.8 | -2.0 | -1.8 | 0.6 |
| Air | 0.8% | 0.7% | 0.8% | 0.7% | 0.7% | 1.1 | 1.0 | 0.9 | 0.8 |
| Total Ton-miles (trillions) | 4.8 | 5.6 | 6.0 | 6.6 | 8.4 | 1.6 | 0.6 | 1.9 | 1.0 |
Source: 2016 Freight Quick Facts Report, DOT, Draft National Freight Strategic Plan, BTS Special Tabulation, Figure 4.
Exhibit 11-3 illustrates freight tonnage in 2014 by mode on the National Highway System (NHS), Class I railroads, and inland waterways.
Exhibit 11-3: Tonnage on Highways, Railroads, and Waterways, 2014
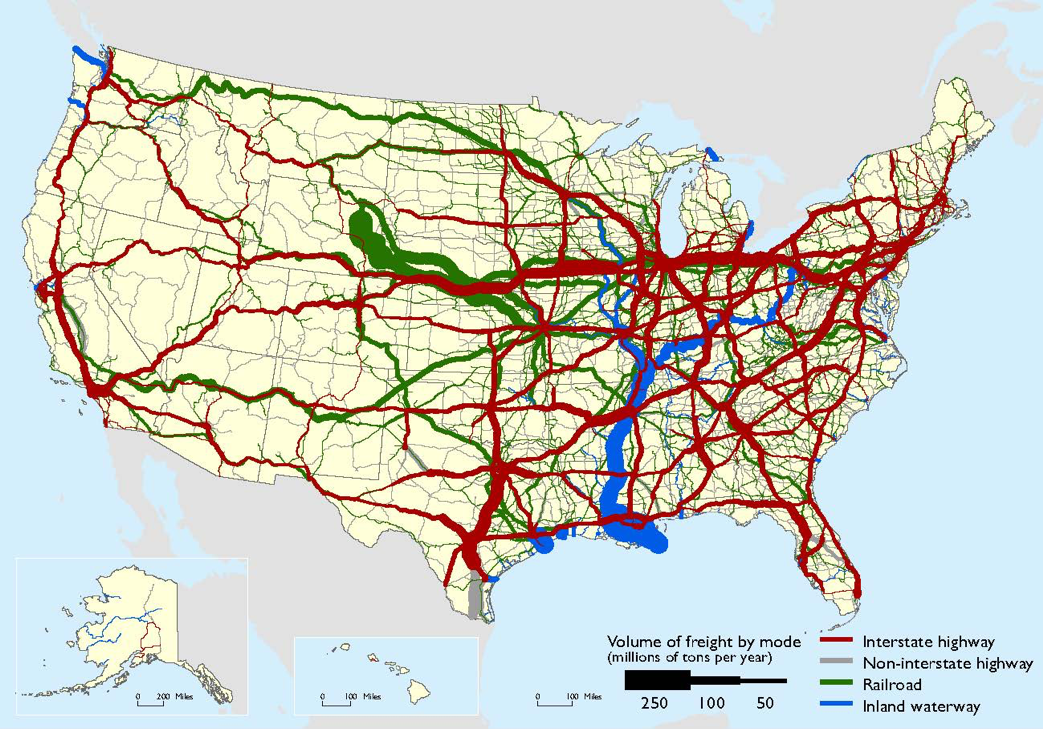
Sources: Highways—Federal Highway Administration, Freight Analysis Framework, Version 4; Rail—Surface Transportation Board, Annual Carload Waybill Sample, Federal Railroad Administration, Rail Freight Flow Assignments (2012); Waterways—U.S. Army Corps of Engineers (USACE), Annual Vessel Operating Activity, Tennessee Valley Authority, Lock Performance Monitoring System data for USACE, USACE Institute for Water Resources, Waterborne Foreign Trade Data, USACE Water Flow Assignments (2012).
Freight Transportation Demand
The BTS publication Freight Facts and Figures 2015 indicates that the U.S. freight transportation system handled a record amount of freight in 2014. A daily average of approximately 55 million tons of freight valued at $49.3 billion moved across the transportation system in 2014 to meet the needs of the Nation’s 122.5 million households, 7.5 million business establishments, and 90,056 Government units.iii
Freight transportation is important to the overall economy. In 2014, freight transportation establishments serving for-hire transportation and warehousing operations employed nearly 4.6 million workers and comprised 9.5 percent of the Nation’s economic activity as measured by gross domestic product (GDP). Truck driving is by far the largest freight transportation occupation, with approximately 2.83 million truck drivers.iv About 57.5 percent of these professional truck drivers operate heavy or tractor-trailer trucks and 28.2 percent drive light or delivery service trucks.v
The BTS Freight Transportation Services Index (TSI) measures the output of services provided by for-hire transportation industries. This freight index correlates strongly with U.S. economic activity and helps illustrate the relationship between freight transportation and long-term changes in the U.S. economy.
Exhibit 11-4 shows the annual Freight TSI figures for the years 2000 and 2005–2016. The TSI declined steadily from 2005 through 2009. However, since 2010, the TSI has steadily increased, reaching its highest level in 2016.
The highway system is the most-used mode of transport for freight by tonnage and by the value of goods moved. The highway system is composed of all Federal, State, local, and private roads that move freight by commercial vehicles. The total tonnage for trucking is forecasted to grow by almost 45 percent by 2045, and the value of freight is forecasted to increase by 84 percent.vi The major highway systems that support the movement of freight are described in the following sections.
Exhibit 11-4: Annual Freight Transportation Services Index, 2000–20161
| Year | Freight TSI |
|---|---|
| 2000 | 100.0 |
| 2005 | 112.4 |
| 2006 | 111.5 |
| 2007 | 110.1 |
| 2008 | 108.8 |
| 2009 | 98.3 |
| 2010 | 106.4 |
| 2011 | 110.9 |
| 2012 | 112.1 |
| 2013 | 116.2 |
| 2014 | 120.4 |
| 2015 | 122.1 |
| 2016 | 122.3 |
1 The TSI is indexed such that the Year 2000 TSI equals 100.0.
Source: U.S. Department of Transportation, Office of the Assistant Secretary for Research and Technology, Bureau of Transportation Statistics.
Freight Highway Systems
National Network
The National Network is the system of roadways officially designated to accommodate commercial freight-hauling vehicles authorized by the Surface Transportation Assistance Act (STAA) of 1982 (P.L. 97-424) and specified in the U.S. Code of Federal Regulations (23 CFR 658). The STAA requires States to allow conventional truck-trailer combinations on the Interstate System and certain portions of the Federal-aid Primary System. Conventional combinations are tractors with one semitrailer up to 48 feet in length or with one 28-foot semitrailer and one 28-foot trailer, and can be up to 102 inches wide. Currently, most States allow conventional combination trucks with single trailers up to 53 feet in length to operate without permits on their portions of the National Network. These National Network routes for conventional combination trucks as of 2014 are illustrated in Exhibit 11-5.
Exhibit 11-5: National Network for Conventional Combination Trucks, 20141,2
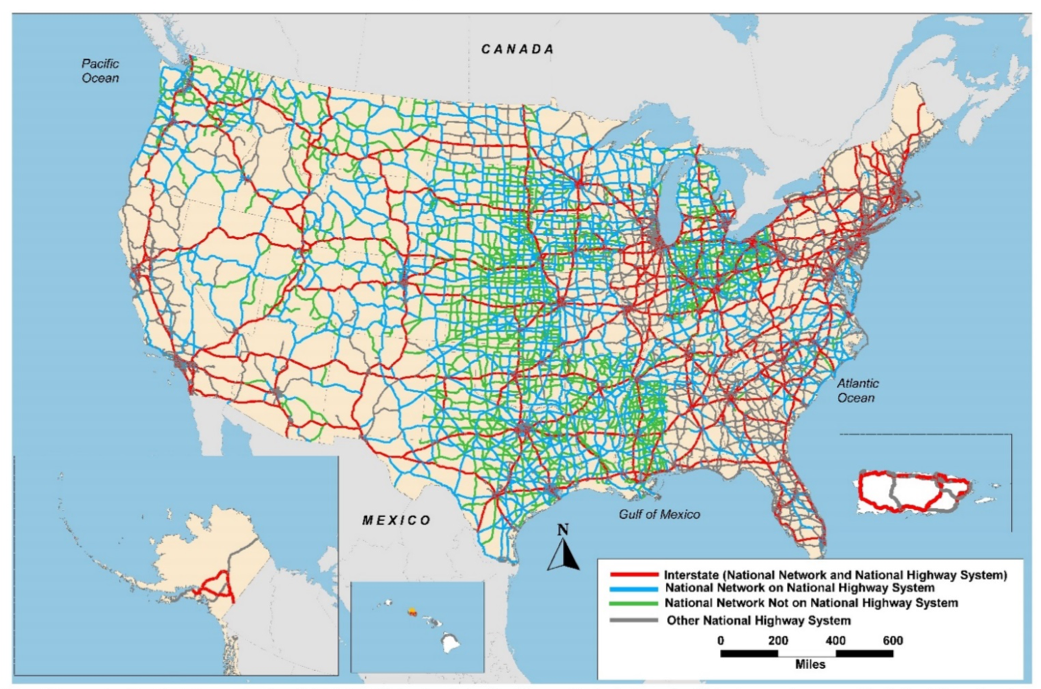
1 This map should not be interpreted as the official National Network and should not be used for truck size and weight enforcement purposes. The National Network and the National Highway System (NHS) are approximately 200,000 miles in length, but the National Network includes 65,000 miles of highways beyond the NHS, and the NHS encompasses about 50,000 miles that are not part of the National Network.
2 “Other NHS” refers to NHS mileage that is not included on the National Network. Conventional combination trucks are tractors with one semitrailer up to 48 feet in length or with one 28-foot semitrailer and one 28-foot trailer. Conventional combination trucks can be up to 102 inches wide.
Source: DOT, FHWA, Office of Freight Management and Operations, Freight Analysis Framework, version 3.4, 2013.
National Highway System
The National Highway System (NHS) consists of roadways important to the Nation’s economy, defense, and mobility. The NHS was developed by DOT in cooperation with the States, local officials, and metropolitan planning organizations (MPOs).
As discussed in Chapter 1, the NHS includes the Interstate System of Highways, other principal arterials, the Strategic Highway Network (STRAHNET), major strategic highway network connectors, and intermodal connectors. Exhibit 11-6 shows the National Highway System as of 2014.
Exhibit 11-6: National Highway System (NHS)
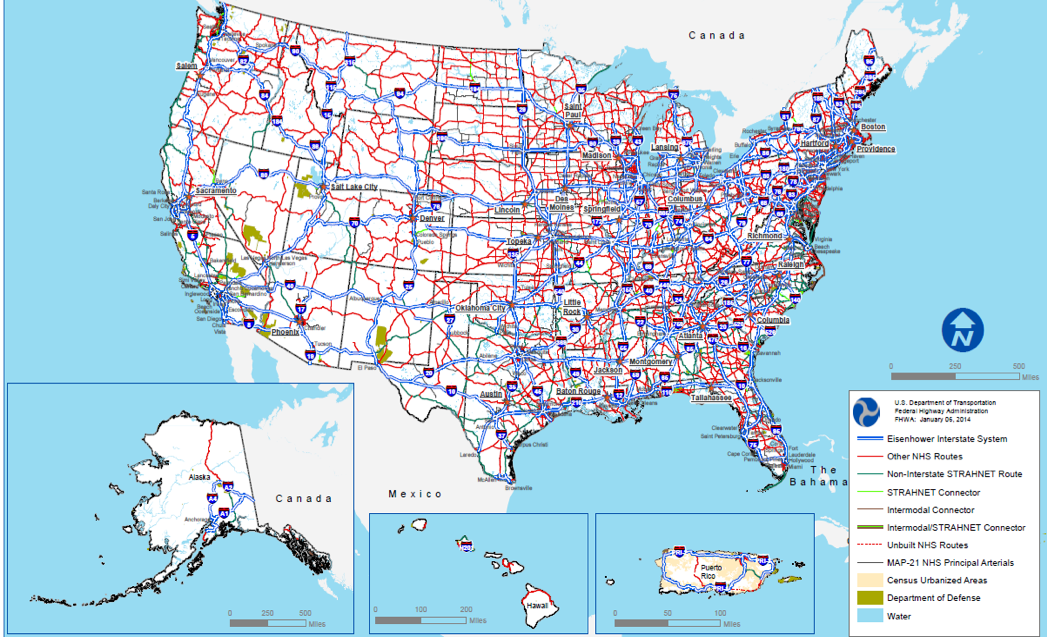
Source: DOT, 2014.
Intermodal Connectors
Freight intermodal connectors are the roads that provide the “last mile” connection between major intermodal freight facilities and the NHS. They are critical components of our transportation system and can affect the timely and reliable delivery of goods. Public roads leading to major intermodal terminals are designated as NHS connectors by the DOT, in cooperation with State departments of transportation and MPOs. When considering changes to the intermodal connectors, FHWA reviews several factors, including annual freight volumes, daily vehicular traffic, and the importance of an intermodal facility within a specific State.vii
Exhibit 11-7 shows the number of new freight intermodal connectors, by mode, added to the NHS and the percentage change between the years 2000 and 2014. In total, 182 connectors were added, representing a 30-percent increase in the designation of intermodal connectors.
Exhibit 11-7: Number of Freight Intermodal Connectors by Mode, 2000–2014
| Mode | 2000 Connectors | 2014 Connectors | Net Change | Percentage Change |
|---|---|---|---|---|
| Port | 252 | 329 | 77 | 31% |
| Rail | 204 | 269 | 65 | 32% |
| Airport | 99 | 132 | 33 | 33% |
| Pipeline | 61 | 68 | 7 | 11% |
| Total | 616 | 798 | 182 | 30% |
Source: Final Report, FHWA Freight Intermodal Connectors Study, April 2017, Table 1.
National Highway Freight Network
The Fixing America’s Surface Transportation (FAST) Act directed the FHWA Administrator to establish a National Highway Freight Network (NHFN) to strategically direct Federal resources and policies toward improved performance of highway portions of the U.S. freight transportation system. (See Exhibit 11-8.)
Exhibit 11-8: National Highway Freight Network (NHFN)
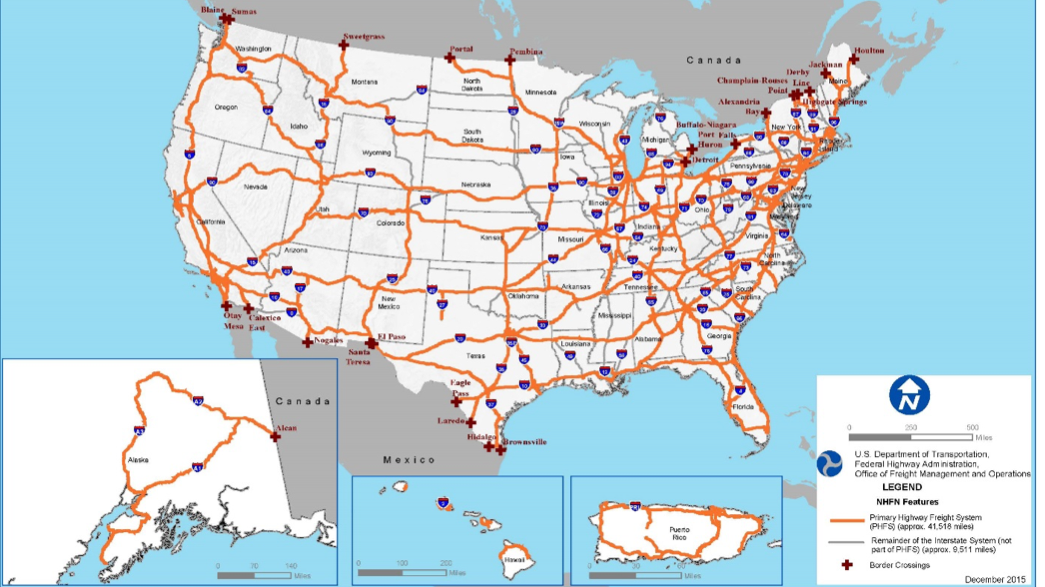
Source: DOT, FHWA Office of Freight Management and Operations, 2015.
The NHFN includes the following subsystems of roadways:
- Primary Highway Freight System (PHFS): This is a network of highways identified as the most critical highway portions of the U.S. freight transportation system, determined by measurable and objective national data. The network consists of 41,518 centerline miles, including 37,436 centerline miles of Interstate and 4,082 centerline miles of non-Interstate roads.
- Other Interstate portions not on the PHFS: These highways consist of the remaining portion of Interstate roads not included in the PHFS. These routes provide important continuity and access to freight transportation facilities. These portions amount to an estimated 9,511 centerline miles of Interstate nationwide, and will fluctuate with additions and deletions to the Interstate Highway System.
- Critical Rural Freight Corridors (CRFCs): These are public roads not in an urbanized area that provide access and connection to the PHFS and the Interstate System with ports, public transportation facilities, or other intermodal freight facilities.
- Critical Urban Freight Corridors (CUFCs): These are public roads in urbanized areas that provide access and connection to the PHFS and the Interstate System with ports, public transportation facilities, or other intermodal transportation facilities.
The NHFN consists of an estimated total of 51,029 centerline miles, not including CRFCs and CUFCs. Congress granted States, and in certain cases, MPOs, the ability to designate additional public roads as CRFCs and CUFCs in accordance with Section 1116 of the FAST Act. Designation is subject to mileage limitations. FHWA must re-designate the PHFS every 5 years, subject to a cap of up to 3 percent growth in total mileage with each re-designation.
Freight on the NHS
As stated earlier, freight transportation is expected to increase over the next 30 years.
Approximately 50 percent of large freight trucks (trucks with a gross vehicle weight of over 10,000 pounds) operate within 50 miles of their origination and account for about 30 percent of truck vehicle miles traveled (VMT). By contrast, only 10 percent of large trucks operate more than 200 miles away from their origin, but these large trucks account for more than 30 percent of overall truck VMT. Long-distance truck travel also accounts for nearly all freight ton-miles and a large share of truck VMT.viii
The map in Exhibit 11-9 illustrates the average daily long haul freight truck volumes on the NHS in 2012, and the map in Exhibit 11-10 illustrates the forecasted average daily long haul truck freight volumes in 2045 on the NHS.
Exhibit 11-9: Average Daily Long Haul Freight Truck Traffic on the NHS, 2012
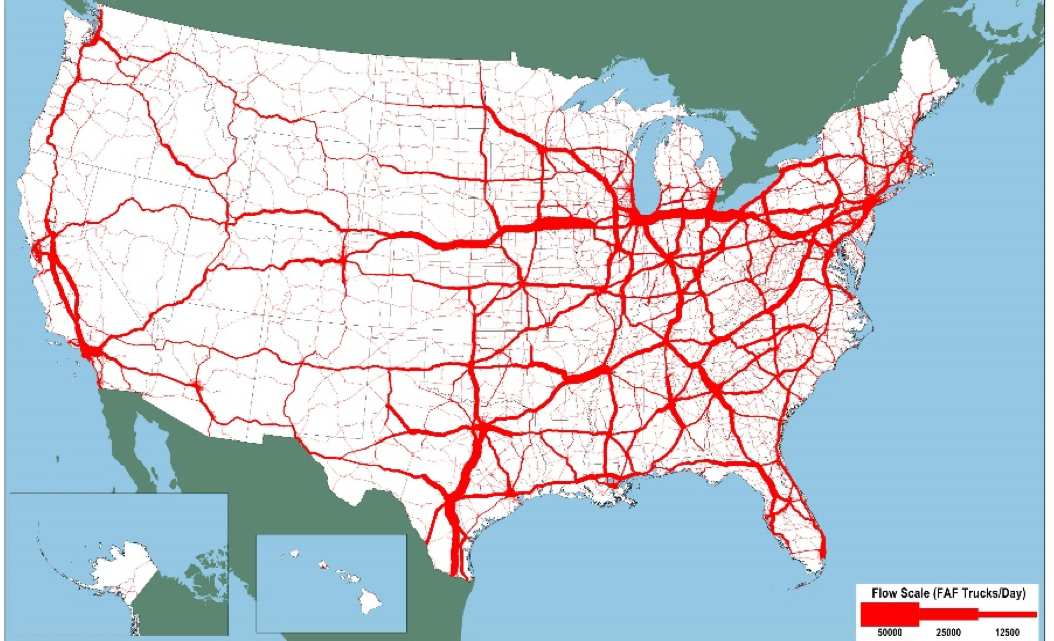
Note: Major flows include domestic and international freight moving by truck on highway segments with more than 25 FAF trucks per day and between places typically more than 50 miles apart.
Source: DOT, FHWA Office of Freight Management and Operations, Freight Analysis Framework, version 4.3, 2017.
Exhibit 11-10: Forecasted Average Daily Long Haul Freight Truck Traffic on the NHS, 2045
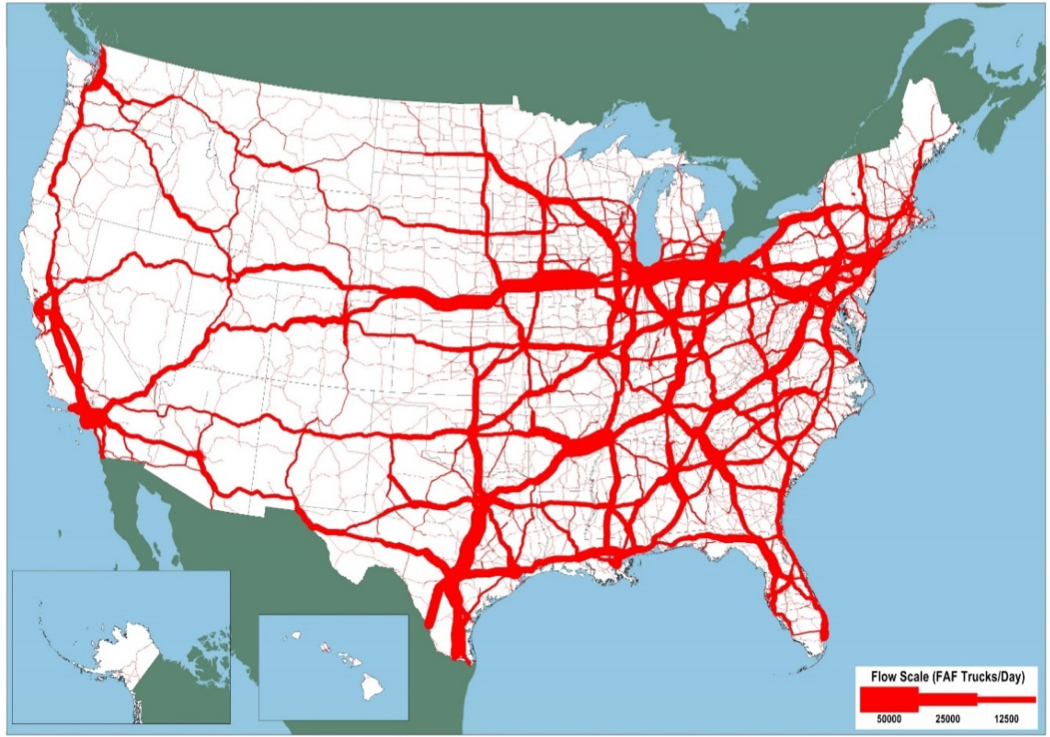
Note: Major flows include domestic and international freight moving by truck on highway segments with more than 25 FAF trucks per day and between places typically more than 50 miles apart.
Source: DOT, FHWA Office of Freight Management and Operations, Freight Analysis Framework, version 4.3, 2017.
These maps illustrate the projected increase in tonnage flows across the NHS (Exhibit 11-10) compared with the current tonnage flows shown in Exhibit 11-9. Truck volumes on many key routes of the NHS are expected to increase significantly between 2014 and 2045. These projected increases can have major implications for highway congestion and freight movement efficiency, especially near large urban areas along major truck corridors.
Trucks carry high-value, time-sensitive freight, as well as lower-value, bulk tonnage such as agricultural products, gasoline for local distribution, and municipal solid waste. Exhibit 11-11 shows truck VMT and registrations for 2014. In this table, data reveal that combination trucks and single-unit trucks account for 9.2 percent of total miles driven in 2014. On average, combination trucks drove approximately five times more miles per year than did single-unit trucks.
Exhibit 11-11: Truck Vehicle Miles Traveled and Registrations, 20141
| Vehicle Type | Urban and Rural Miles | Registered Vehicles | Average VMT per Year | ||
|---|---|---|---|---|---|
| Billion VMT | Percent | Billion VMT | Percent | ||
| Single-unit Trucks | 109.3 | 3.6 | 8.3 | 3.2 | 13,123 |
| Combination Trucks | 169.8 | 5.6 | 2.6 | 1.0 | 65,897 |
| All Vehicles | 3,025.7 | 100.0 | 260.4 | 100.0 | 11,621 |
1 VMT = vehicle miles traveled.
Source: FHWA Highway Statistics 2014, Table VM-1. (https://www.fhwa.dot.gov/policyinformation/statistics/2014/vm1.cfm)
The map in Exhibit 11-12 identifies the major truck routes on the NHS. These routes handle more than 8,500 trucks per day or are routes where trucks comprise at least 25 percent of the traffic.
Exhibit 11-12: Major Truck Routes on the NHS1
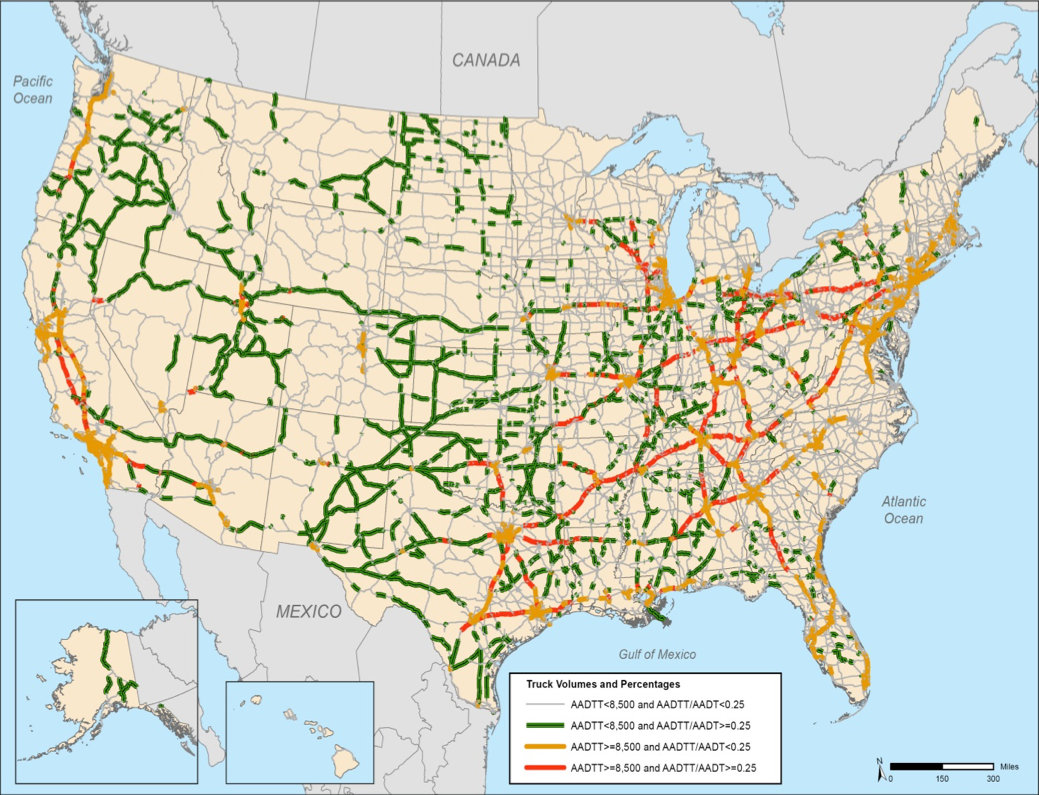
1 AADTT is average annual daily truck traffic and includes all freight-hauling and other trucks with six or more tires. AADT is average annual daily traffic and includes all motor vehicles. NHS mileage as of 2011, prior to MAP-21 system expansion.
Source: DOT, FHWA Office of Freight Management and Operations, Freight Analysis Framework, Version 3.4, 2013.
Top 25 Domestic Freight Corridors
To determine the top 25 domestic freight corridors, FHWA used Freight Analysis Framework (FAF), version 3 data to identify the top 10 percent of the FAF highway segments by tonnage. FHWA connected segments with the highest tonnage and known freight generators (land uses or groups of land uses that generate high freight transportation volumes, such as truck terminals, intermodal rail yards, water ports, airports, warehouses and distribution centers, or large manufacturing facilities) or population centers (origins and destinations). Exhibit 11-13 shows the top 25 key corridors with the greatest network commodity tonnage of freight movement, based on FAF data for 2015.
Exhibit 11-13: Top 25 Corridors by Freight Tonnage, 2015
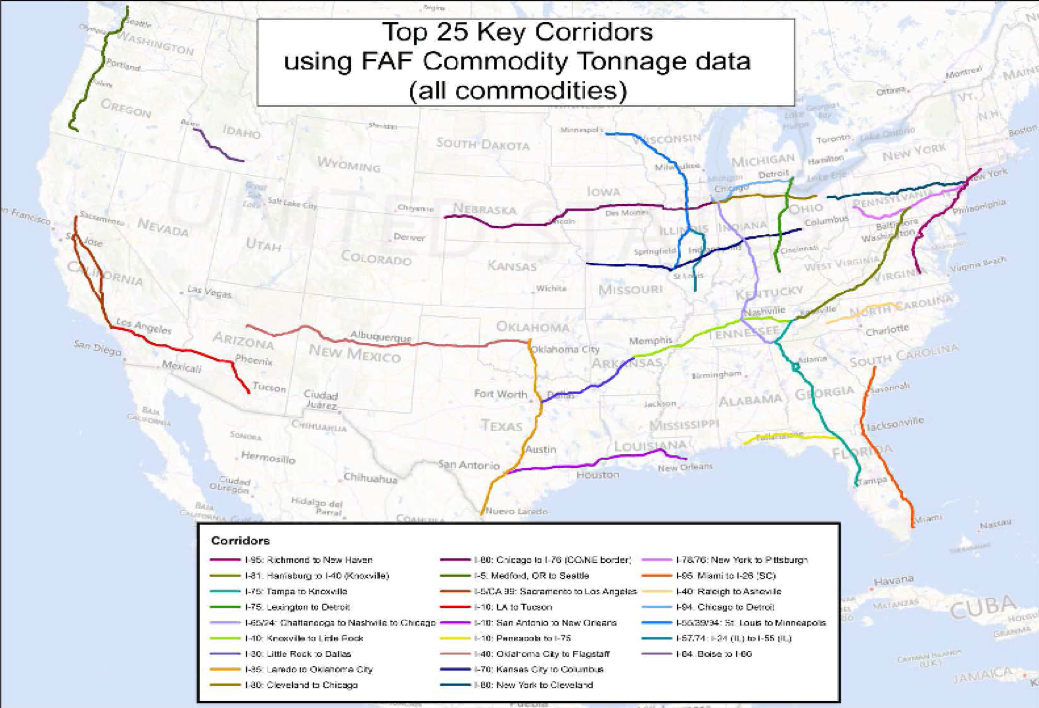
Source: DOT, FHWA Office of Freight Management and Operations, Freight Analysis Framework, FAF version 3.
Freight Challenges
There are substantial challenges to moving freight on a highway network that is projected to see continued increases in freight volume but may be difficult to expand in places to provide additional capacity. To address the challenges and ensure that the U.S. freight system and its highway network are prepared to support U.S. economic growth and competitiveness, freight stakeholders will need to understand and address the impact of increased freight movement on such areas as safety, reliability, efficiency, and the environment. A few of those challenges are described in this section.
Truck Parking
One of the major challenges to the effective movement of freight is that of safe and available truck parking. An inadequate supply of truck parking spaces can have negative consequences. Tired truck drivers may continue to drive because they have difficulty finding a place to park for rest. Truck drivers may choose to park at unsafe locations, such as on the shoulder of the road, exit ramps, or vacant lots, if they are unable to locate official, available parking. With the projected growth of truck traffic, the demand for truck parking will continue to outpace the supply of public and private parking facilities and could exacerbate truck parking problems experienced in many regions.
To address this concern, the Jason’s Law Truck Parking Survey Results and Comparative Analysis report evaluated the adequacy of truck parking capacity across the Nation. FHWA worked with the American Association of State Highway and Transportation Officials (AASHTO) and other industry stakeholders to develop a truck parking survey that was responsive to a requirement in MAP-21. The survey was administered to every State in 2014. In addition, survey responses were provided by truck drivers, State motor carrier safety enforcement officials, travel plaza and truck stop owners and operators, trucking firm managers, and logistics personnel.
The survey results provided insight into issues associated with providing and maintaining commercial vehicle parking facilities and services, including shortages in geographic regions and a lack of truck parking information. The survey found that more than 75 percent of truck drivers responding said they regularly experienced problems with finding “safe parking locations when rest was needed.” Ninety percent reported struggling to find safe parking at night. The report also documented the location of more than 308,000 truck parking spaces, including 36,000 at public rest areas and nearly 273,000 at private truck stops.ix
The Jason’s Law report identified several key findings, including the following:
- Truck parking capacity is a problem in all States. The greatest problems were found on major freight corridors and in large metropolitan areas.
- Consistent, continued measurement and data are important to understanding dynamic truck parking needs and whether the situation is changing.
- Truck parking analysis is an important component of State and MPO freight plans, as well as regional and corridor-based freight planning.
- There is a need to understand the supply chains of key industries and major commodities.
- There is a need to understand the movement of freight, within and through a State, to better anticipate and plan for parking needs.
- Local regulations and zoning requirements often create challenges for the development of truck parking facilities.
- Public- and private-sector coordination is critical to address long-term truck parking needs.
The Jason’s Law survey found that 38 States reported having truck parking problems in 2014. Truck drivers, however, reported truck parking problems in all States.
Most States provided information on observed problems, including shortages and the existence of unofficial parking (parking in areas not designated for parking). Only limited information was reported on actual use of the parking facilities, maintenance, and future parking capacity plans.
The Jason’s Law survey responses indicated that truck drivers were observed using other, unofficial parking places due to parking shortages. This is indicated in Exhibit 11-14, a chart showing the types of truck parking locations in which parking problems were reported by States in 2014.
Exhibit 11-14: Locations of Truck Parking Problems Reported by States, 2014
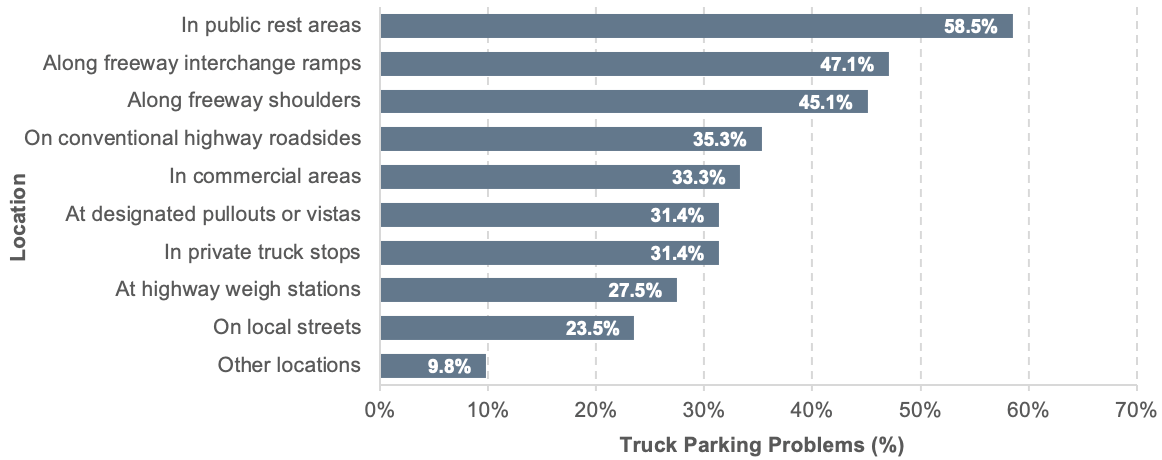
Source: DOT, Jason’s Law Truck Parking Survey Results and Comparative Analysis: Survey of State Departments of Transportation, Figure 9.
Exhibit 11-15 shows the 15 Interstate corridors most identified with parking shortages, according to a survey of truck drivers by the trucking industry.
Exhibit 11-15: Top 15 Interstates with Truck Parking Shortages Cited by OOIDA/ATA Truck Drivers and Professionals, 2014
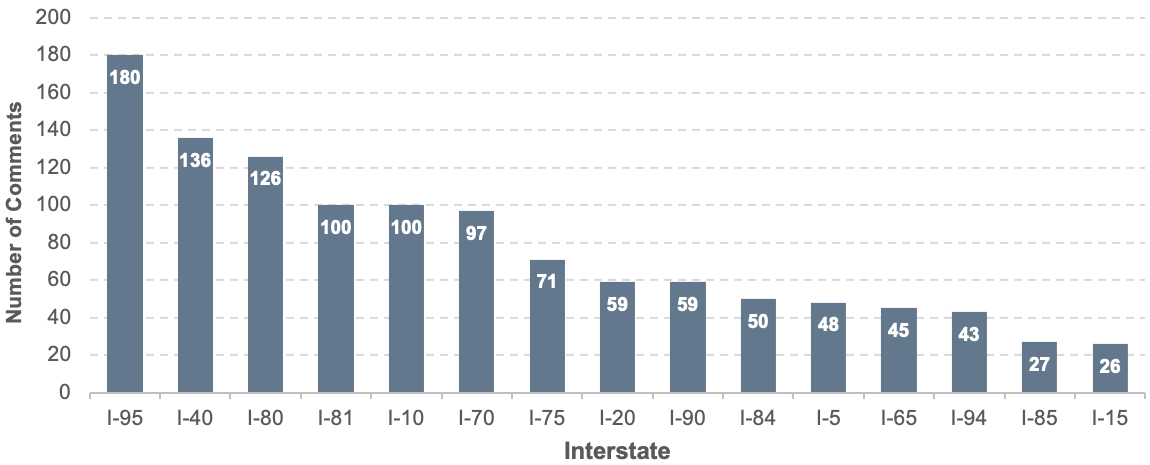
Source: American Trucking Associations and Owner Operator Independent Drivers Association Survey.
Additional analysis would be necessary to understand fully truck parking issues, including a comparison of parking utilization across origins and destinations; and near freight generators (such as distribution centers), intermodal facilities, and ports.
i DOT Releases 30-Year Freight Projections, BTS 13-16, 3/3/16. (https://www.bts.gov/statistical-releases) [Return to Section]
ii BTS, 2016. Freight Facts and Figures 2015. [Return to Section]
iii BTS, 2016. Freight Facts and Figures 2015, pg. 3. [Return to Section]
iv BTS, 2017. Transportation Economic Trends, Chapter 4: Transportation Employment. (https://cms.bts.dot.gov/archive/publications/transportation_economic_trends/ch4/index) [Return to Section]
v DOT, FHWA, 2016. Freight Quick Facts Report, September 2016, pp. 3, 9. [Return to Section]
vi BTS, 2016. Freight Facts and Figures 2015, pg. 3. [Return to Section]
vii DOT, FHWA, 2017. Freight Intermodal Connectors Study, Final Report, April 2017. [Return to Section]
viii BTS, 2016. Freight Facts and Figures 2015, pg. 4. [Return to Section]
ix (https://ops.fhwa.dot.gov/freight/infrastructure/truck_parking/jason_law/truckparkingsurvey/jasons_law.pdf) [Return to Section]