

Chapter 2: Funding

Key Takeaways
- The revenue collected in 2014 from all levels of government for highways and bridges was $241.1 billion. All levels of government combined spent $222.6 billion for highways in 2014. The difference of $18.6 billion between the total revenues and the total expenditures during the year represents an increase in the Federal, State, and local combined cash balances in 2014.
- In 2014, the overall split between user charges and other sources was 44.1 percent versus 55.9 percent. The reliance on different sources, however, differs significantly by level of government. After 2008, due to flat user revenues and transfers to keep the Highway Trust Fund solvent, the share of user revenues fell below 50 percent.
- Of the $105.4 billion in total highway capital outlay in 2014, an estimated $65.4 billion (62.0 percent) was used for system rehabilitation, $25.9 billion (24.5 percent) was used for system expansion, and $14.2 billion (13.5 percent) was used for system enhancement.
- Total capital outlays on Federal-aid highways were $79.3 billion in 2014. During the same year, capital outlays for the National Highway System and the Interstate System amounted to $56.3 billion and $25.3 billion, respectively.
- From 2004 to 2014, federally funded highway expenditures decreased at an average annual rate of 0.5 percent in constant-dollar terms. The State and local constant-dollar expenditures grew by an average 1.3 percent annually for the same period.
- Many States are increasingly adopting nontraditional financing and delivery methods for transportation projects. They include a variety of public-private partnerships and debt-financing mechanisms.
Highway Funding
This chapter presents data and analyses on funding trends for highways and transit across all levels of government and sources of funding. The revenue sources for investments in highways and bridges are discussed first, followed by details on total highway expenditures and, more specifically, capital outlays. A separate section presents data on transit system funding, highlighting trends in revenues, capital, and operating expenditures.
The classification of the revenue and expenditure items in this section is based on definitions contained in A Guide to Reporting Highway Statistics (https://www.fhwa.dot.gov/policyinformation/hss/guide/guide.pdf), which is the instructional manual for States providing financial data for the Highway Statistics publication (https://www.fhwa.dot.gov/policyinformation/statistics.cfm).
Revenue Sources for Highways
The revenue collected in 2014 from all levels of government for highways and bridges was $241.1 billion, as illustrated in Exhibit 2-1. Of the total revenues generated, the Federal government contributed $54.9 billion; State governments, $121.4 billion; and local governments, $64.8 billion.
These revenues were raised from user charges (motor-fuel taxes, motor-vehicle taxes and fees, and tolls) and several other sources (General Fund appropriations, other taxes, investment income, and debt financing). In 2014, the overall split between user charges and other sources was 44.1 percent versus 55.9 percent. The reliance on different sources, however, differs significantly by level of government.
Exhibit 2-1: Government Revenue Sources for Highways, 2014
| Source | Highway Revenue, Billions of Dollars | ||||
|---|---|---|---|---|---|
| Federal | State | Local | Total | Percent | |
| User Charges1 | |||||
| Motor-Fuel Taxes | $28.0 | $31.7 | $1.0 | $60.6 | 25.1% |
| Motor-Vehicle Taxes and Fees | $4.9 | $24.5 | $2.1 | $31.4 | 13.0% |
| Tolls | $0.0 | $12.3 | $2.1 | $14.3 | 5.9% |
| Subtotal | $32.8 | $68.4 | $5.2 | $106.4 | 44.1% |
| Other | |||||
| Property Taxes and Assessments | $0.0 | $0.0 | $12.8 | $12.8 | 5.3% |
| General Fund Appropriations2 | $20.6 | $9.6 | $26.2 | $56.5 | 23.4% |
| Other Taxes and Fees | $0.4 | $10.3 | $6.7 | $17.4 | 7.2% |
| Investment Income and Other Receipts3 | $1.0 | $10.1 | $7.6 | $18.7 | 7.8% |
| Bond Issue Proceeds | $0.0 | $22.9 | $6.3 | $29.2 | 12.1% |
| Subtotal | $22.1 | $53.0 | $59.7 | $134.7 | 55.9% |
| Total Revenues | $54.9 | $121.4 | $64.8 | $241.1 | 100.0% |
| Funds Drawn From (or Placed in) Reserves | ($7.6) | ($10.2) | ($0.8) | ($18.6) | -7.7% |
| Total Expenditures Funded During 2014 | $47.3 | $111.2 | $64.1 | $222.6 | 92.3% |
1 Amounts shown represent only the portion of user charges that are used to fund highway spending; a portion of the revenue generated by motor-fuel taxes, motor-vehicle taxes and fees, and tolls is used for mass transit and other nonhighway purposes. Gross receipts generated by user charges totaled $136.8 billion in 2014.
2 The $20.6 billion shown for Federal includes $17.4 billion transferred from the general fund to the Highway Account of the Highway Trust Fund. The remainder supported expenditures by the FHWA and other Federal agencies that were not paid for from the Highway Trust Fund.
3 The $1.0 billion figure shown for Federal includes $1.0 billion transferred from the balance of the Leaking Underground Storage Tank Fund to the Highway Account of the Highway Trust Fund.
Sources: Highway Statistics 2015, Table HF-10A (preliminary), and unpublished FHWA data.
User charges, in particular motor-fuel taxes, account for most of the Federal revenues raised for highways—60.0 percent in 2014. User charges also account for most of the revenues that State governments raise. In 2014, State governments raised $121.4 billion of highway funding, of which $68.4 billion (56 percent) derived from State-imposed fees on highway users. Funding from other sources ($53.0 billion) included $22.9 billion from bond sale proceeds. In contrast, the revenues that local governments raise for highways derive mainly from sources other than user charges. This difference is partly because many States prohibit local governments from imposing taxes on motor fuel or motor vehicles—and where local taxes are allowed, they are often capped at low rates. The source on which local governments rely most heavily for highways is General Fund appropriations, which in 2014 accounted for 40.0 percent, or $26.2 billion, of the total $64.8 billion in revenue raised. The next largest sources were property taxes and investment income, at $12.8 billion and $7.6 billion. User charges generated only $5.2 billion of revenue.
As shown in Exhibit 2-1, all levels of government combined spent $222.6 billion for highways in 2014. The $18.6-billion difference between total revenues and expenditures represents an increase in the Federal, State, and local combined cash balances in 2014.
Disposition of Highway-User Revenue by Level of Government in 2014
The $106.4 billion identified as highway-user charges in Exhibit 2-1 represents only 77.8 percent of total highway-user revenue, defined as all revenue generated by motor-fuel taxes, motor-vehicle taxes, and tolls. Exhibit 2-2 shows that combined highway-user revenue collected in 2014 by all levels of government totaled $136.8 billion.
In 2014, $16.2 billion of highway-user revenue was used for transit, and $14.2 billion was used for other purposes, such as ports, schools, collection costs, and general government activities. The $1.7 billion shown as Federal highway-user revenue used for other purposes reflects the difference between total collections in 2014 and the amounts deposited into the Highway Trust Fund during Fiscal Year 2014. Much of this difference is attributable to the proceeds from the deposits of the 0.1-cent-per-gallon portion of the Federal motor-fuel tax into the Leaking Underground Storage Tank Trust Fund.
The $5.9 billion shown as Federal highway-user revenue used for transit includes deposits into the Transit Account of the Highway Trust Fund and deposits into the Highway Account of the Highway Trust Fund that States elected to use for transit purposes.
Exhibit 2-2: Disposition of Highway-User Revenue by Level of Government, 2014
| Revenue Use | Revenue, Billions of Dollars | |||
|---|---|---|---|---|
| Federal | State | Local | Total | |
| Highways | $32.8 | $68.4 | $5.2 | $106.4 |
| Transit | $5.9 | $9.2 | $1.2 | $16.2 |
| Other | $1.7 | $12.4 | $0.1 | $14.2 |
| Total Collected | $40.4 | $90.0 | $6.4 | $136.8 |
Source: Highway Statistics 2015, Table HF-10A (preliminary).
Total proceeds to the Highway Account of the Highway Trust Fund (HTF) have been less than expenditures out of the Highway Account for every year since 2001 except 2005. A total of $53.0 billion was transferred from the Federal General Fund to the Highway Account in 2008, 2009, 2010, 2013, and 2014 to keep the account solvent. In 2014, $17.4 billion was transferred from the Federal General Fund to the HTF Highway Account. In addition, in 2014, $1.0 billion was transferred from the balance of the Leaking Underground Storage Tank Fund to the Highway Account. The 2014 amount is identified as “Investment Income and Other Receipts” in Exhibit 2-1, although the original source of these funds was revenues generated in prior years from a 0.1-cent-per-gallon tax on motor fuels.
The Investment Income and Other Receipts category in Exhibit 2-1 includes development fees and special district assessments and private-sector investment in highways, to the extent that such investment is captured in State and local accounting systems.
Financing for highways comes from both the public and private sectors. The private sector has increasingly been instrumental in the delivery of highway infrastructure, but the public sector still provides the vast majority of funding. The financial statistics presented in this chapter are drawn predominantly from State reports based on State and local accounting systems. Figures in these systems can include some private-sector investment; where so, these amounts are generally classified as “Other Receipts.” For additional information on public-private partnerships (P3s) in transportation, see (https://www.fhwa.dot.gov/ipd/p3).
HTF Highway Account Excise Tax Receipts and Expenditures
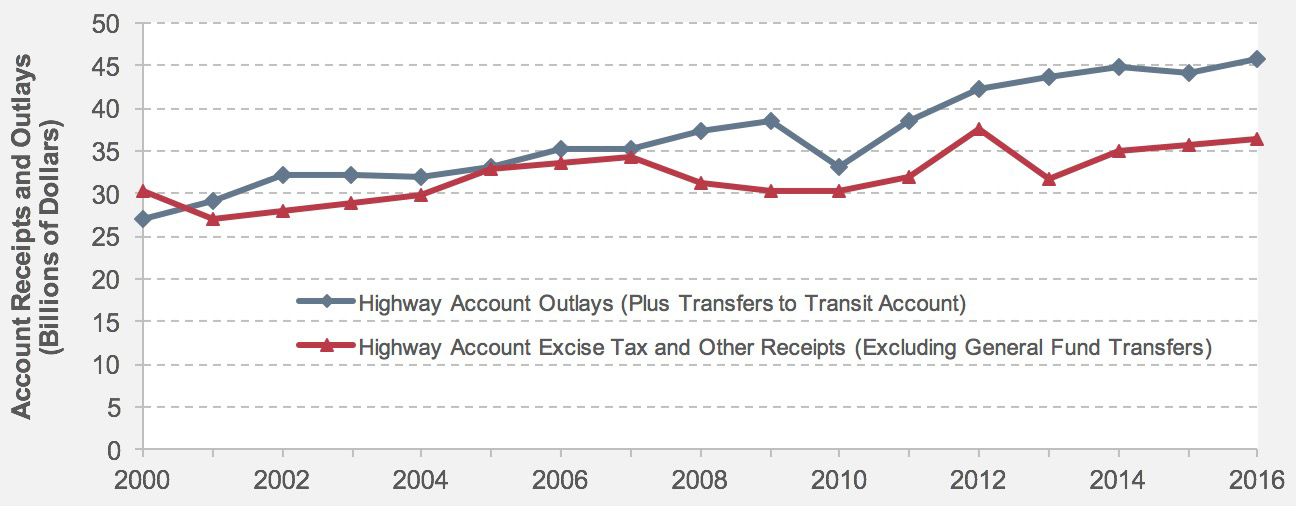
The last time that annual net receipts credited to the Highway Account of the HTF exceeded annual expenditures from the Highway Account was in 2000. As shown in Exhibit 2-3, for each year since 2000, total annual receipts to the Highway Account from excise taxes and other income (such as interest income and motor-carrier safety fines and penalties) have been lower than the annual expenditures from the Highway Account (including amounts transferred to the Transit Account).
The HTF Highway Account receipts and outlays shown in Exhibit 2-3 do not include transfers from the General Fund. To help maintain a positive cash balance in the HTF, transfers from the General Fund to the HTF were legislatively mandated in Fiscal Years 2008, 2009, 2010, 2013, and 2014. In Fiscal Years 2012 and 2014, funds were also transferred from the balance of the Leaking Underground Storage Tank Fund to the HTF; the original source of these funds was revenues generated in previous years from a 0.1-cent-per-gallon portion of the Federal tax on motor fuels.
Exhibit 2-3: Highway Trust Fund Highway Account Receipts and Outlays, Fiscal Years 2000–2016
Source: Highway Statistics, various years, Tables FE-210 and FE-10.
Revenue Trends
Following passage of the Federal-aid Highway Act of 1956 and establishment of the HTF, user charges such as motor-fuel taxes, motor-vehicle taxes, and tolls consistently provided most of the combined revenues raised for highway and bridge programs by all levels of government for many years. However, after 2008, due to flat user revenues and transfers to keep the HTF solvent, the share of user revenues fell below 50 percent.
Exhibit 2-4 shows the trends in revenues used for highways by source for all levels of government from 2004 to 2014. From 2012 to 2014, total revenues generated for highways increased from $216.6 billion to $241.1 billion. This increase was driven mainly by a $16.7 billion jump in General Fund appropriations and a $5.2 billion increase in bond issue proceeds. All other sources of revenue also increased between these two years, except for investment income, which fell by $2.4 billion. The combined motor-fuel and motor-vehicle tax revenues rose by $0.6 billion, while toll revenues rose by $0.9 billion. Revenues from property taxes and other taxes went up by $2.7 and $1.3 billion respectively.
Exhibit 2-4: Government Revenue Sources for Highways, 2004–2014

| Source | Highway Revenue, Billions of Dollars | Annual Rate of Change 2014/2004 |
|||||
|---|---|---|---|---|---|---|---|
| 2004 | 2006 | 2008 | 2010 | 2012 | 2014 | ||
| Motor-Fuel and Motor-Vehicle Taxes | $76.4 | $85.4 | $84.7 | $84.1 | $91.5 | $92.1 | 1.9% |
| Tolls | $6.6 | $8.3 | $9.1 | $9.7 | $13.5 | $14.3 | 8.1% |
| Property Taxes and Assessments | $7.5 | $9.0 | $9.0 | $10.1 | $10.1 | $12.8 | 5.6% |
| General Fund Appropriations | $23.6 | $28.3 | $40.0 | $61.5 | $39.8 | $56.5 | 9.1% |
| Other Taxes and Fees | $7.9 | $10.1 | $12.2 | $13.5 | $16.1 | $17.4 | 8.2% |
| Investment Income & Other Receipts | $7.6 | $9.7 | $16.6 | $15.8 | $21.1 | $18.7 | 9.5% |
| Bond Issue Proceeds | $15.8 | $18.3 | $20.9 | $33.7 | $24.0 | $29.2 | 6.3% |
| Total Revenues | $145.3 | $169.0 | $192.6 | $228.3 | $216.1 | $241.1 | 5.2% |
Source: Highway Statistics, various years, Tables HF-10A and HF-10.
From 2004 to 2014, total revenues for highways increased at an annual rate of 5.2 percent. The increase in motor-fuel and motor-vehicle taxes revenues was 1.9 percent, the lowest among the funding sources. At the opposite end, investment income and other receipts increased at the highest average annual rate, 9.5 percent, over the 10-year period. General Fund appropriations are next with an increase of 9.1 percent per year, despite the recent decline from their peak in 2010. The average annual increases in highway revenues over the same period from other taxes and fees, tolls, and property taxes were 8.2, 8.1, and 5.6 percent respectively.
The graph at the top of Exhibit 2-4 shows the percentage share of each funding source by year for 2004–2014. After 2006, the share of revenues from user charges, excluding tolls, had declined from more than 50 percent to around 40 percent.
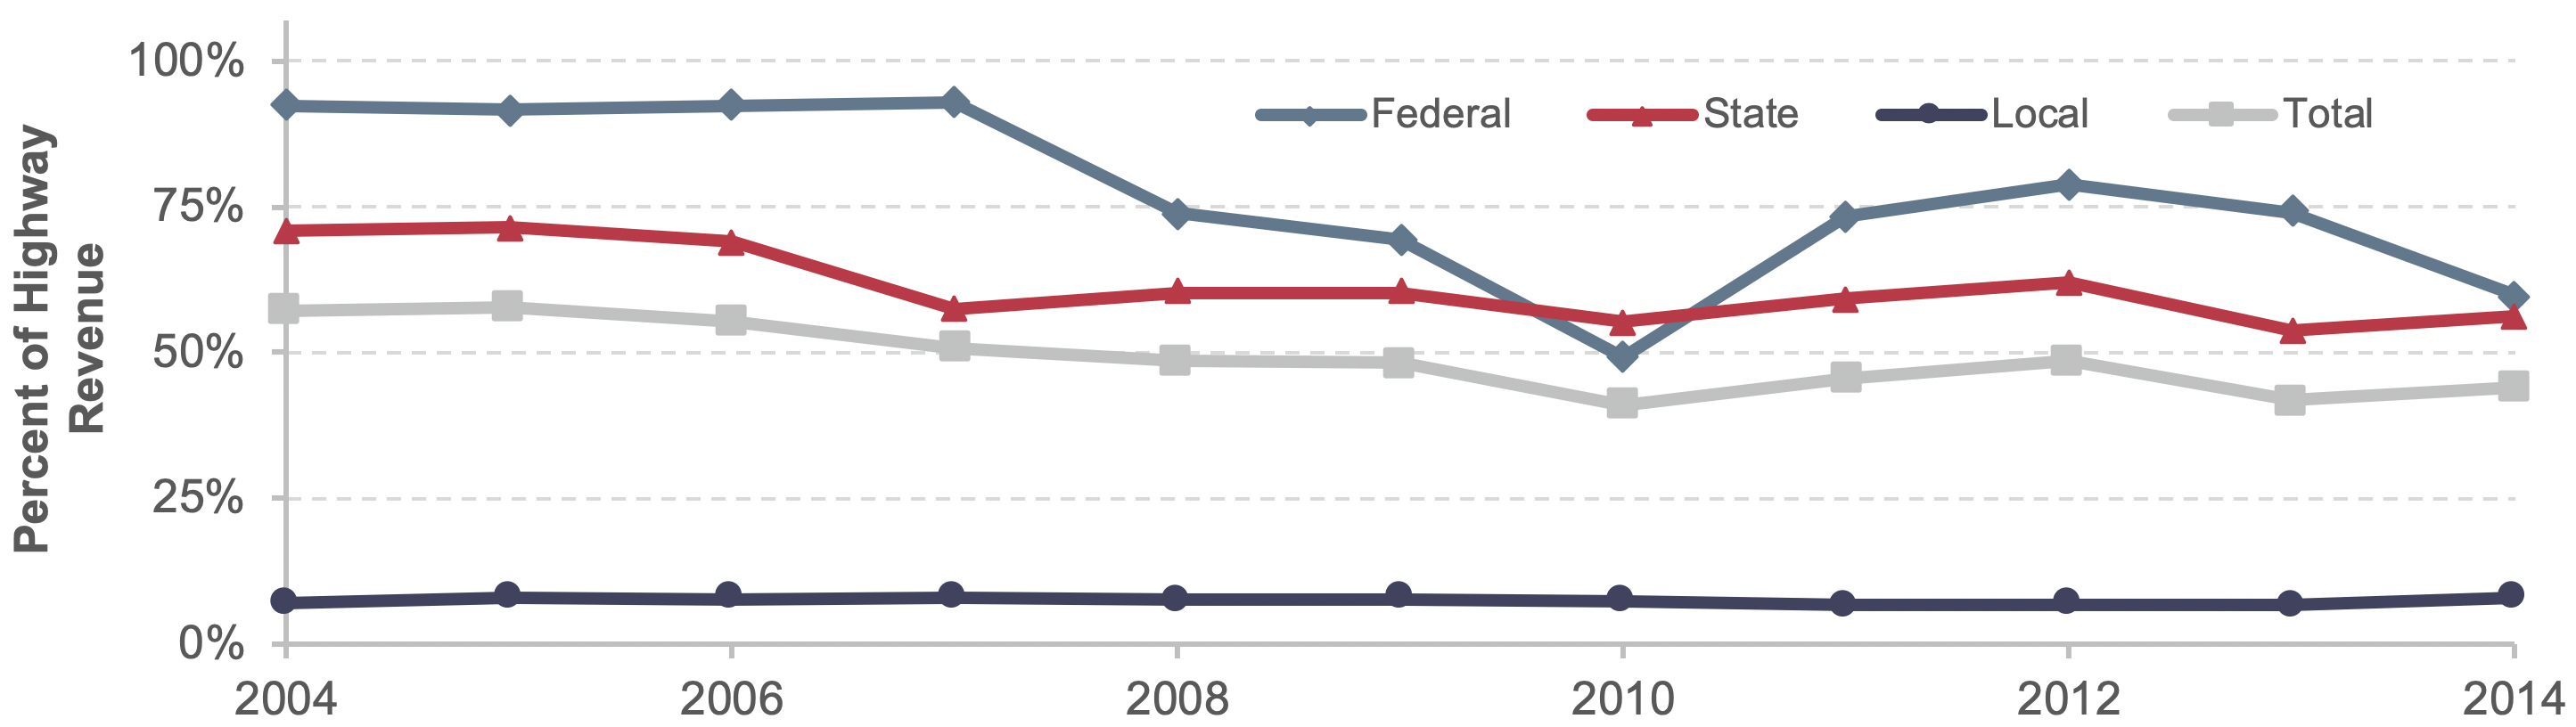
Exhibit 2-5 shows the change in the share of highway revenue derived from user charges by level of government. The share declined at the Federal and State levels while remaining steady at the local level from 2004 to 2014. At the Federal level, the decline from 2007 to 2010 can be attributed in part to General Fund transfers to the HTF and to General Funds provided for highway improvements through the Recovery Act. Between 2010 and 2014, the percentage of Federal highway revenue derived from user charges increased from 49.1 percent to 59.8 percent (though it fell from 2012 to 2014). The State and local governments’ user revenue share also increased slightly during this period.
Exhibit 2-5: Percentages of Highway Revenue Derived from User Charges, Each Level of Government, 2004–2014
Source: Highway Statistics, various years, Tables HF-10A and HF-10.
State Revenue Actions
In addition to Federal funding, States use a variety of revenue sources to support their transportation expenditures. These revenue sources include State fuel taxes, vehicle fees, sales taxes, tolls, mode-specific revenues, cigarette taxes, and State lotteries.
According to the 2016 AASHTO report A 50-State Review of State Legislatures and Departments of Transportation, State taxes on motor fuels are the largest single source of State revenues for highways, representing more than 30 percent of such revenues nationwide. Over the past decades, fuel tax rates have fallen in real terms because the Federal fuel tax and many State fuel taxes are fixed at static cents-per-gallon rates. In response, many States have structured their fuel tax rates to change over time. Some of these taxes are periodically adjusted based on a measure of inflation, while others are calculated as a percentage of wholesale or retail fuel prices, or by some other criterion. In addition to fuel taxes, some States have structured other taxes and fees so that they keep up with inflation. For example, in Maryland, transit fares are indexed to the Consumer Price Index, as are some toll revenues in Florida. In addition to the impacts of inflation, fuel tax revenues are affected by the increasing fuel efficiency of the vehicle fleet and the use of alternative fuels that may not be taxed or taxed at lower rates.
Tolling is another source of revenue for funding transportation projects. Tolling involves charging fees for the use of a roadway facility. Tolls may be charged as a flat, per-use fee on motorists to use a highway, or they may involve the imposition of fees or tolls that vary by level of vehicle demand on a highway facility (also known as road pricing, congestion pricing, value pricing, or variable pricing). While pricing generates revenue, this strategy also seeks to manage congestion, environmental impacts, and other external costs occasioned by road users.
State and local governments also rely on a variety of nonroad revenue mechanisms to generate revenue that may be tied to specific transportation projects, such as local option taxes, value capture, fares, and other nonpricing revenue sources. Such strategies can be used to help pay for highway improvements by leveraging localized benefits ranging from increased land values to a broader tax base.
Many States have also shown interest in the possibility of charging drivers based on the number of miles they drive, known as “mileage-based user fees.” In July 2015, Oregon was the first State to test a mileage-based user fee. Oregon’s program is designed to collect 1.5 cents per mile from up to 5,000 cars and light commercial vehicles, and to deposit the revenues to the State’s highway fund. In addition, the Federal Fixing America's Surface Transportation (FAST) Act provides $95 million over 5 years in grants for States to “demonstrate user-based alternative revenue mechanisms that utilize a user fee structure to maintain the long-term solvency of the HTF.” Additional information on revenue is available at (https://www.fhwa.dot.gov/ipd/revenue/).
Highway Expenditures
Highway expenditures by all levels of government combined totaled $222.6 billion in 2014, as shown in Exhibit 2-1. Exhibit 2-6 breaks down the Federal, State, and local expenditures by type. The rows “Funding Sources for Capital Outlay” and “Funding Sources for Total Expenditures” indicate the level of government that provided the funding for those expenditures. These expenditures represent cash outlays, not authorizations or obligations of funds. (The terms “expenditures,” “spending,” and “outlays” are used interchangeably in this report.)
Exhibit 2-6: Direct Expenditures for Highways by Expending Agency and Type, 2014
| Highway Expenditures (Billions of Dollars) | |||||
|---|---|---|---|---|---|
| Federal | State | Local | Total | Percent | |
| Expenditures by Type | |||||
| Capital Outlay | $0.7 | $80.5 | $24.2 | $105.4 | 47.4% |
| Noncapital Expenditures | |||||
| Maintenance | $0.2 | $16.2 | $21.8 | $38.2 | 17.2% |
| Highway and Traffic Services | $0.0 | $7.3 | $6.0 | $13.2 | 6.0% |
| Administration | $2.3 | $8.4 | $5.7 | $16.4 | 7.4% |
| Highway Patrol and Safety | $0.0 | $9.5 | $10.3 | $19.8 | 8.9% |
| Interest on Debt | $0.0 | $8.2 | $3.3 | $11.5 | 5.2% |
| Subtotal | $2.5 | $49.5 | $47.2 | $99.2 | 44.6% |
| Total, Current Expenditures | $3.2 | $130.0 | $71.4 | $204.6 | 91.9% |
| Bond Retirement | $0.0 | $11.6 | $6.3 | $17.9 | 8.1% |
| Total, All Expenditures | $3.2 | $141.6 | $77.7 | $222.6 | 100.0% |
| Funding Sources for Capital Outlay1 | |||||
| Funded by Federal Government | $0.7 | $43.4 | $0.7 | $44.8 | 42.5% |
| Funded by State or Local Governments | $0.0 | $37.1 | $23.5 | $60.6 | 57.5% |
| Total | $0.7 | $80.5 | $24.2 | $105.4 | 100.0% |
| Funding Sources for Total Expenditures1 | |||||
| Funded by Federal Government | $3.2 | $43.4 | $0.7 | $47.3 | 21.2% |
| Funded by State Governments | $0.0 | $95.1 | $16.1 | $111.2 | 50.0% |
| Funded by Local Governments | $0.0 | $3.2 | $60.9 | $64.1 | 28.8% |
| Total | $3.2 | $141.7 | $77.7 | $222.6 | 100.0% |
1 Amounts shown in italics are provided to link this table back to revenue sources shown in Exhibit 6-1. These are nonadditive to the rest of the table, which classifies spending by expending agency.
Sources: Highway Statistics 2015, Table HF-10A (preliminary), and unpublished FHWA data.
Even though the Federal government funded $47.3 billion of highway expenditures in 2014, direct Federal spending on capital outlay, maintenance, administration, and research was only $3.2 billion (1.4 percent of all highway expenditures). The remaining $44.1 billion was in the form of transfers to State and local governments.
State governments combined $43.4 billion of Federal funds, $95.1 billion of State funds, and $3.2 billion of local funding sources to support direct expenditures of $141.7 billion (63.6 percent of all highway expenditures). Local governments directly spent $0.7 billion of Federal funds, $16.1 billion of State funds, and $60.9 billion of local funds on highways, totaling $77.7 billion (34.9 percent of all highway expenditures).
Types of Highway Expenditures
Definitions for selected expenditure category types referenced in this section are as follows:
- Capital outlay: highway improvements such as new construction, reconstruction, resurfacing, rehabilitation, and restoration; and installation of guardrails, fencing, signs, and signals. It also includes the cost of land acquisition and other right-of-way costs and preliminary and construction engineering, in addition to construction costs.
- Maintenance: routine and regular expenditures required to keep the highway surface, shoulders, roadsides, structures, and traffic control devices in usable condition. These efforts include spot patching and crack sealing of roadways and bridge decks, and maintaining and repairing highway utilities and safety devices, such as route markers, pavement markings, signs, guardrails, fences, signals, and highway lighting.
- Highway and traffic services: activities designed to improve the operation and appearance of the roadway, including items such as the operation of traffic control systems, snow and ice removal, highway beautification, litter pickup, mowing, toll collection, and air quality monitoring.
- Current expenditures: all highway expenditures except for bond retirement (principal only).
- Noncapital expenditures: all current expenditures except for capital outlay. (Includes interest payments on bonds.)
As shown in Exhibit 2-6, $105.4 billion, or 47.4 percent of spending by all levels of government on highways in 2014, was used for capital outlays. Additional information on types of capital outlay and the distribution of capital outlay by type of highway facility is presented later in this chapter. Combined spending on maintenance and traffic services of $51.6 billion represented 23.2 percent of total highway expenditures.
Most Federal funding for highways is for capital outlay rather than noncapital expenditures, which State and local governments primarily fund. The Federal government funded 42.5 percent of capital outlay in 2014, but only 21.2 percent of total highway expenditures.
In terms of direct highway expenditures by expending agency, State expenditures represent a majority of total spending for most expenditure types except for highway patrol and safety, and maintenance. Local governments spent $21.1 billion on maintenance in 2014, which is 56.3 percent of total maintenance spending by all levels of government combined. Local governments also spent $10.3 billion on highway patrol and safety expenditures, representing 52.0 percent of combined spending on these activities by all levels of government.
Historical Expenditure and Funding Trends
Exhibit 2-7 breaks out expenditures since 2004 by type. The largest percentage increases are related to debt service, as bond retirement expenditures grew at an average annual rate of 8.4 percent from 2004 to 2014, while interest on debt grew at an average annual rate of 7.1 percent. Total highway expenditures grew by 4.2 percent per year over this period in nominal dollar terms. Capital outlay rose at an average annual rate of 4.1 percent, thus maintaining its share of total expenditures.
Exhibit 2-7: Expenditures for Highways by Type, All Units of Government, 2004–2014
| Expenditure Type | Highway Expenditures, Billions of Dollars | Annual Rate of Change 2014/2004 |
|||||
|---|---|---|---|---|---|---|---|
| 2004 | 2006 | 2008 | 2010 | 2012 | 2014 | ||
| Capital Outlay | $70.3 | $80.2 | $90.4 | $100.0 | $105.3 | $105.4 | 4.1% |
| Maintenance and Traffic Services | $36.3 | $40.8 | $45.9 | $46.3 | $48.5 | $51.4 | 3.5% |
| Administration | $12.7 | $13.1 | $17.8 | $16.5 | $16.0 | $16.4 | 2.6% |
| Highway Patrol and Safety | $14.3 | $14.7 | $17.3 | $16.8 | $18.3 | $19.8 | 3.3% |
| Interest on Debt | $5.8 | $6.6 | $8.5 | $10.1 | $11.5 | $11.5 | 7.1% |
| Total, Current Expenditures | $139.5 | $155.5 | $180.0 | $189.7 | $199.5 | $204.6 | 3.9% |
| Bond Retirement | $8.0 | $8.1 | $8.6 | $14.6 | $18.9 | $17.9 | 8.4% |
| Total, All Expenditures | $147.5 | $163.5 | $188.5 | $204.3 | $218.4 | $222.6 | 4.2% |
Source: Highway Statistics, various years, Tables HF-10A and HF-10.
Exhibit 2-8 shows that Federal expenditures for highways increased in nominal terms between 2004 and 2014; however, it declined slightly in real terms using the inflation rate for highway construction (see the Constant-Dollar Expenditures section below). The portion of total highway expenditures funded by the Federal Government declined from 22.4 percent in 2004 to 21.2 percent in 2014. The federally funded share of highway capital outlays exceeded 50 percent each year from 1976 to 1986. Since then, this share has typically varied from 41 to 46 percent. In 1998, 1999, and 2007, however, it fell below 40 percent. From 2005 through 2014, the average of the federally funded share of highway capital outlay was 43.0 percent. The federally funded share of 42.5 percent in 2014 is slightly below the 10-year average.
Exhibit 2-8: Funding for Highways by Level of Government, 2004–2014
| Highway Funding, Billions of Dollars | Annual Rate of Change 2014/2004 |
||||||
|---|---|---|---|---|---|---|---|
| 2004 | 2006 | 2008 | 2010 | 2012 | 2014 | ||
| Capital Outlay | |||||||
| Funded by Federal Government | $30.8 | $34.6 | $37.6 | $43.3 | $45.3 | $44.8 | 3.8% |
| Funded by State or Local Governments | $39.5 | $45.6 | $52.8 | $56.7 | $60.0 | $60.6 | 4.4% |
| Total | $70.3 | $80.2 | $90.4 | $100.0 | $105.3 | $105.4 | 4.1% |
| Federal Share | 43.8% | 43.1% | 41.6% | 43.3% | 43.0% | 42.5% | |
| Total Expenditures | |||||||
| Funded by Federal Government | $33.1 | $36.3 | $39.8 | $46.1 | $47.3 | $47.3 | 3.6% |
| Funded by State Governments | $72.8 | $77.4 | $96.6 | $98.7 | $105.2 | $111.2 | 4.3% |
| Funded by Local Governments | $41.6 | $49.8 | $52.2 | $59.5 | $65.8 | $64.1 | 4.4% |
| Total | $147.5 | $163.5 | $188.5 | $204.3 | $218.4 | $222.6 | 4.2% |
| Federal Share | 22.4% | 22.2% | 21.1% | 22.6% | 21.7% | 21.2% | |
Source: Highway Statistics, various years, Tables HF-10A and HF-10.
The Federal expenditure figures for 2010 include $11.9 billion funded by the Recovery Act. This figure dropped to $3.0 billion by 2012 and $0.2 billion by 2014 as most Recovery Act projects were completed. Federally funded highway expenditures remained at $47.3 billion between 2012 and 2014, while State funding increased from $105.8 billion to $111.2 billion. Local government highway funding declined slightly from $65.8 billion to $64.1 billion over the same period.
Constant-Dollar Expenditures
The types of inputs of materials and labor associated with various types of highway expenditures differ significantly; for example, on a dollar-per-dollar basis, highway maintenance activities are generally more labor-intensive than highway construction activities. This report uses different indices for converting nominal dollar highway spending to constant dollars for capital and noncapital expenditures. For constant-dollar conversions for highway capital expenditures, the Federal Highway Administration (FHWA) National Highway Construction Cost Index (NHCCI) version 2.0 is used. Constant-dollar conversions for other types of highway expenditures are based on the Bureau of Labor Statistics’ Consumer Price Index.
Implications of the Revision of the FHWA National Highway Construction Cost Index
The National Highway Construction Cost Index, first published in 2009, is a price index intended to measure the average changes in the prices of highway construction costs over time and to convert nominal dollar highway construction expenditures to constant-dollar expenditures. FHWA uses data on State website postings of winning bids submitted on highway construction contracts to compile the NHCCI. The index covers the universe of the Nation’s highway projects and represents an average cost index for all highway construction.
In recent years, the NHCCI index has exhibited stagnant or declining values. This trend was not consistent with the price changes exhibited by other national level price indicators, such as the Producer Price Index. Thus, FHWA initiated and completed an index review resulting in an updated NHCCI index version 2, published in 2017. The updated NHCCI is consistently higher than the previous index. This results in constant-dollar highway capital expenditures over time being lower than they would otherwise have been using the previous NHCCI.
Exhibit 2-9 illustrates the trends in cost indices used in the report, converted to a common base year of 2004. Over the 10-year period from 2004 to 2014, the Construction Cost Index increase of 51.5 percent (4.2 percent per year) is significantly higher than the increase in the Consumer Price Index of 25.3 percent (2.3 percent per year). In addition, the indices behaved differently.
For example, in the period between 2004 and 2008, sharp increases in the prices of materials such as steel, asphalt, and cement caused NHCCI to increase by 49.2 percent, compared with a 14.0 percent increase in the Consumer Price Index. Highway construction prices as measured by NHCCI subsequently declined but resumed their upward trend after 2010. Despite these fluctuations, this index is consistently higher than the Consumer Price Index from 2004 to 2014. The implication is that the purchasing power of a dollar in highway capital expenditures has declined more than in noncapital expenditures over that period.
Exhibit 2-9: Comparison of Inflation Indices (Converted to a 2004 Base Year), 2004–20141
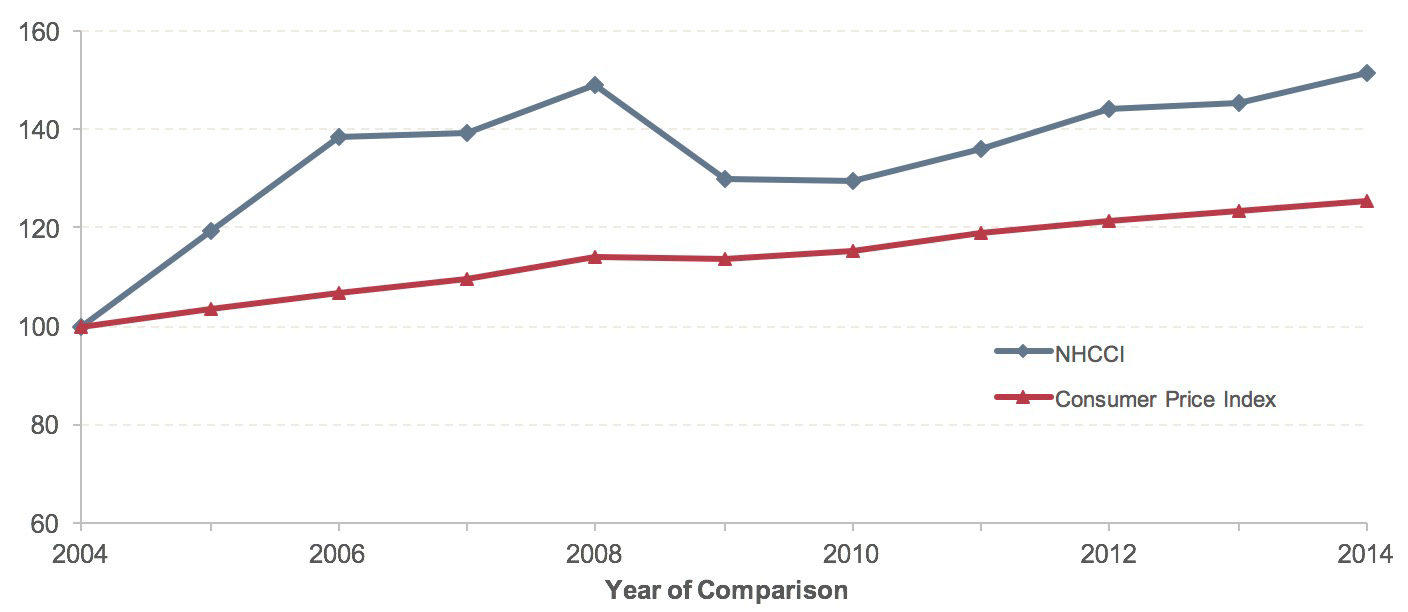
1 To facilitate comparisons of trends from 2004 to 2014, each index was mathematically converted so that its value for the year 2004 would be equal to 100.
Source: FHWA Highway Statistics, various years, Table PT-1 (http://www.bls.gov/cpi/).
Exhibits 2-10 and 2-11 display time-series data on highway expenditures in both current (nominal) and constant (real) 2014 dollars. Total highway expenditures in current dollars have generally increased from 2004, reaching 222.6 billion in 2014. However, total highway expenditures expressed in constant dollars have flattened after 2009. Total highway expenditures in current dollars increased by 50.9 percent between 2004 and 2014. Total noncapital (other) expenditures grew similarly in current dollars by 51.7 percent, and capital expenditures grew by 50.0 percent during the same period. When expressed in constant dollars, the growth in total highway expenditures between 2004 and 2014 was 9.5 percent. However, while constant-dollar noncapital expenditures grew by 21.0 percent, constant-dollar capital expenditures declined by 1.0 percent during the same period. The difference is due to the noncapital highway expenditures being converted to constant dollars using the Consumer Price Index, while NHCCI is applied for the capital highway expenditures. From 2004 to 2014, NHCCI increased by 51.5 percent, significantly higher than the increase in the Consumer Price Index of 25.3 percent.
From 2004 to 2014, federally funded highway expenditures decreased at an average annual rate of 0.5 percent in constant-dollar terms. This decrease was more than compensated for by an average 1.3 percent annual growth of State and local constant-dollar expenditures.
Exhibit 2-10: Highway Capital, Noncapital, and Total Expenditures in Current and Constant 2014 Dollars, All Units of Government, 2004–20141
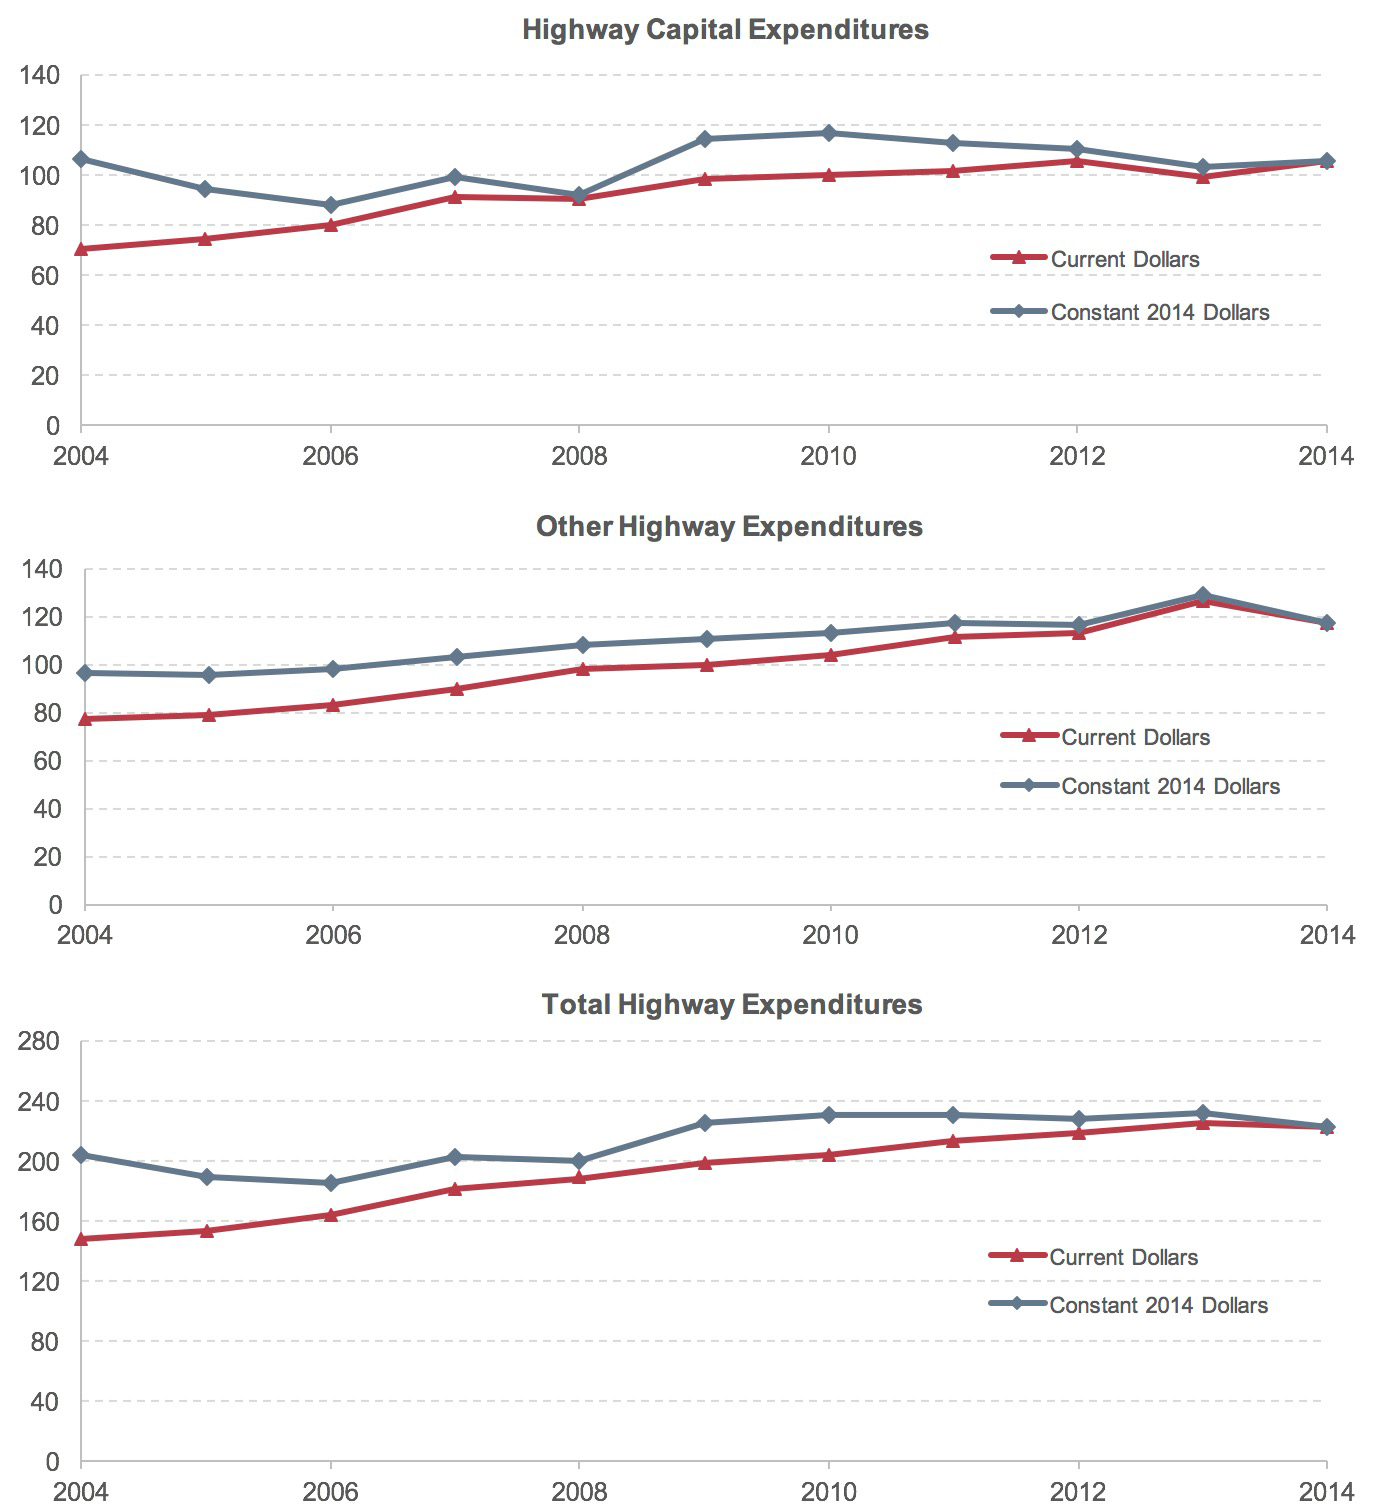
1 Constant-dollar conversions for highway capital expenditures were made using the FHWA NHCCI. Constant-dollar conversions for other types of highway spending were made using the Bureau of Labor Statistics CPI.
Sources: Highway Statistics, various years, Tables HF-10A, HF-10, PT-1 (http://www.bls.gov/cpi/).
Exhibit 2-11: Highway Expenditures Funded by Federal and Non-Federal Sources in Current and Constant 2014 Dollars, 2004–20141
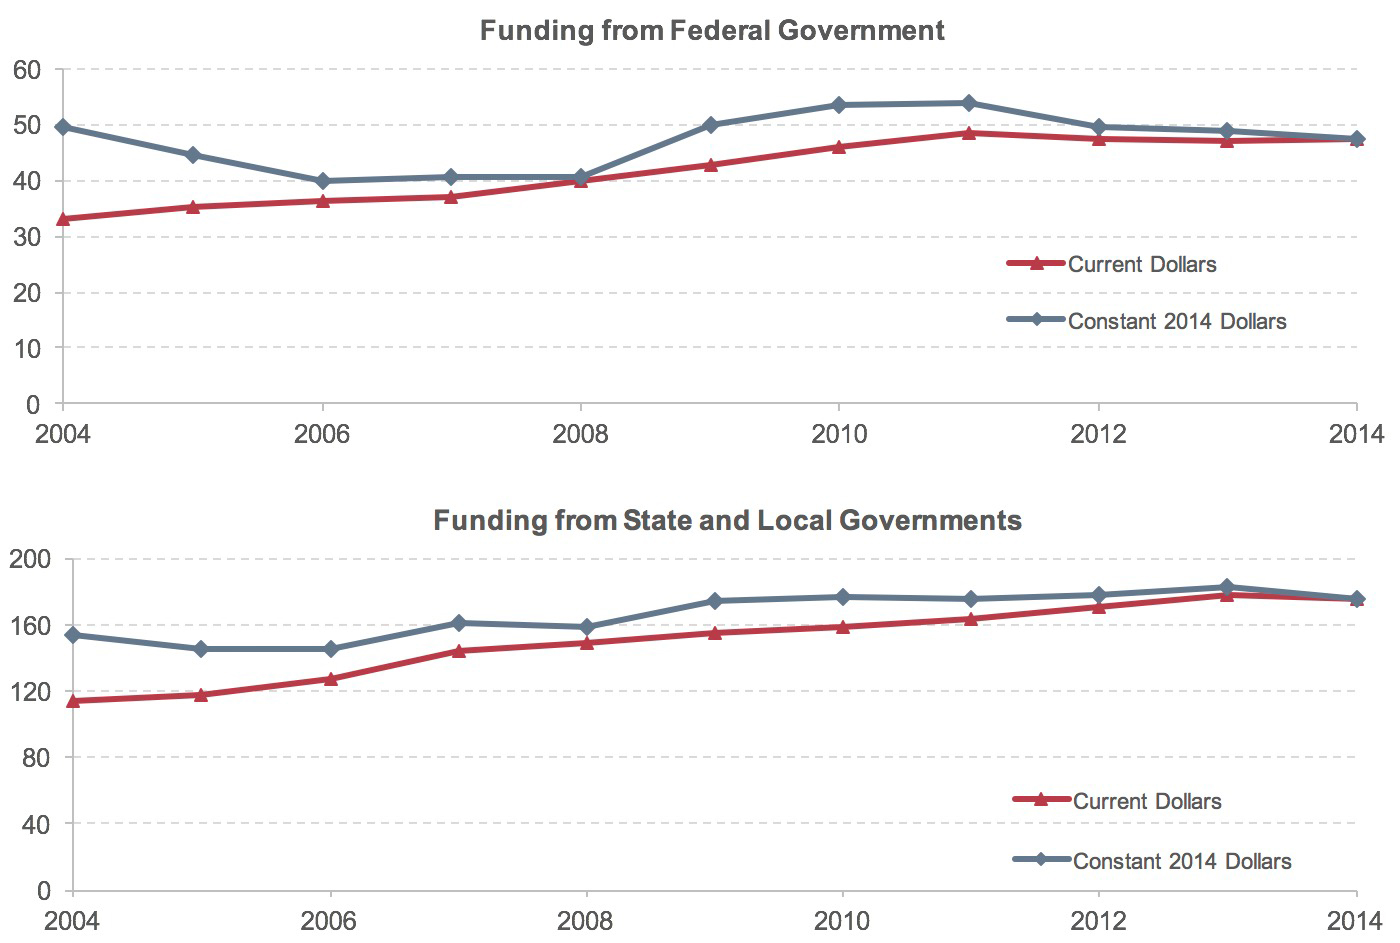
1 Constant-dollar conversions for highway capital expenditures were made using the FHWA NHCCI. Constant-dollar conversions for other types of highway spending were made using the Bureau of Labor Statistics CPI.
Highway Statistics, various years, Tables HF-10A, HF-10, PT-1 (http://www.bls.gov/cpi/).
Highway Capital Outlay
States provide FHWA with detailed data on what they spend on arterials and collectors, classifying capital outlay on each functional system into 17 improvement types. Direct State expenditures on arterials and collectors totaled $68.4 billion in 2014, drawing on a combination of State revenues, transfers from the Federal government, and transfers from local governments. However, comparable data are not available for local government expenditures, direct expenditures by Federal agencies, or State government expenditures on local functional class roads off the National Highway System (NHS). Exhibit 2-12 presents an estimated distribution by broad categories of improvement types for the total $105.4 billion invested in 2014 on all systems, extrapolating from the available data on the $68.4 billion of State expenditures on arterials and collectors.
Exhibit 2-12 shows how the 17 highway capital improvement types have been allocated among three broad categories: system rehabilitation, system expansion, and system enhancement. These broad categories are also used in Part II of this report to discuss the components of future capital investment scenarios. These categories are defined as follows:
- System rehabilitation: capital improvements on existing roads and bridges intended to preserve the existing pavement and bridge infrastructure. These activities include reconstruction, resurfacing, pavement restoration or rehabilitation, widening of narrow lanes or shoulders, bridge replacement, and bridge rehabilitation. Also included is the portion of widening (lane addition) projects estimated for reconstructing or improving existing lanes. System rehabilitation does not include routine maintenance costs.
- System expansion: construction of new roads and new bridges and addition of new lanes to existing roads. Expansion includes all new construction, new bridges, and major widening, and most of the costs associated with reconstruction with added capacity, except for the portion of these expenditures estimated for improving existing lanes of a facility.
- System enhancement: safety enhancements, traffic operation improvements such as the installation of intelligent transportation systems, and environmental enhancements.
Exhibit 2-12: Highway Capital Outlay by Improvement Type, 2014
| Type of Expenditure | Distribution of Capital Outlay, Billions of Dollars | ||||
|---|---|---|---|---|---|
| System Rehabilitation | System Expansion | System Enhancements | Total Outlay | ||
| New Roads and Bridges | Existing Roads | ||||
| Direct State Expenditures on Arterials and Collectors | |||||
| Right-of-Way | $1.6 | $2.0 | $3.6 | ||
| Engineering | $5.5 | $0.8 | $1.1 | $0.9 | $8.3 |
| New Construction | $4.7 | $4.7 | |||
| Relocation | $0.8 | $0.8 | |||
| Reconstruction—Added Capacity | $1.8 | $4.3 | $6.1 | ||
| Reconstruction—No Added Capacity | $4.9 | $4.9 | |||
| Major Widening | $2.4 | $2.4 | |||
| Minor Widening | $0.8 | $0.8 | |||
| Restoration and Rehabilitation | $20.5 | $20.5 | |||
| Resurfacing | $0.0 | $0.0 | |||
| New Bridge | $1.0 | $1.0 | |||
| Bridge Replacement | $5.2 | $5.2 | |||
| Major Bridge Rehabilitation | $0.5 | $0.5 | |||
| Minor Bridge Work | $3.5 | $3.5 | |||
| Safety | $2.5 | $2.5 | |||
| Traffic Management/Engineering | $1.1 | $1.1 | |||
| Environmental and Other | $2.4 | $2.4 | |||
| Total, State Arterials and Collectors | $42.8 | $8.1 | $10.6 | $6.9 | $68.4 |
| Total, Arterials and Collectors, All Jurisdictions (estimated)1 | |||||
| Highways and Other | $39.0 | $8.5 | $12.5 | $8.8 | $68.8 |
| Bridges | $11.0 | $1.3 | $12.3 | ||
| Total, Arterials and Collectors | $50.0 | $9.8 | $12.5 | $8.8 | $81.1 |
| Total Capital Outlay on All Systems (estimated)1 | |||||
| Highways and Other | $51.0 | $11.0 | $13.2 | $14.2 | $89.4 |
| Bridges | $14.4 | $1.6 | $16.0 | ||
| Total, All Systems | $65.4 | $12.7 | $13.2 | $14.2 | $105.4 |
| Percent of Total | 62.0% | 12.0% | 12.5% | 13.5% | 100.0% |
1 Improvement type distribution was estimated based on State arterial and collector data.
Sources: Highway Statistics 2014, Table SF-12A, and unpublished FHWA data.
Of the $105.4 billion in total highway capital outlay, an estimated $65.4 billion (62.0 percent) was used for system rehabilitation, $25.9 billion (24.5 percent) was used for system expansion, and $14.2 billion (13.5 percent) was used for system enhancement. As shown in Exhibit 2-12, most types of highway capital improvement reported by States are assigned to one of these three broad categories; however, engineering is split among the three categories and reconstruction-added capacity is divided between system rehabilitation and system expansion.
Estimation Procedures Used for Exhibit 2-12
Exhibit 2-12 reflects two types of estimates, one for State government capital expenditures off the National highway system and another for direct local government and Federal government capital expenditures.
States report total capital expenditures via the FHWA-532 form and report detailed information on capital expenditures by improvement type and functional class on the FHWA-534 report. Reporting is optional for capital expenditures on local functional class roads off the National Highway System, so the differences between the totals reported on these two forms are inferred to represent spending on these roads. States voluntarily reported detailed capital expenditure data for $1.2 billion of their spending on local functional class roads in 2014, constituting 10.1 percent of total spending of $12.1 billion inferred to have occurred in that year. Of the $1.2 billion, States reported spending 64.6 percent for system preservation, 13.3 percent for system expansion, and 22.0 percent for system enhancement.
The percentage splits reported for local functional class roads were then compared with those reported for arterials and collectors, collectors, and rural minor collectors to identify any unexpected outliers. After minor adjustments based on this review, a distribution of 63.1 percent for system preservation, 14.9 percent for system expansion, and 22.0 percent for system enhancement was applied to the $12.1 billion inferred to have occurred on local functional class roads in 2014.
For direct local government expenditures and direct Federal government expenditures, the distribution of capital expenditure by improvement type off the NHS is assumed to be the same as that reported by States for each individual functional class. The share of local and Federal capital expenditures on the NHS and distribution of capital expenditure by improvement type on the NHS is derived based on local government spending data from prior years when such information was routinely collected from the States. The distribution of local and Federal government spending by functional class is based on the estimated distribution of travel, multiplied by weighting factors derived from spending data from prior years.
Exhibit 2-13 shows the distribution of capital expenditures by type and functional system. In 2014, $29.9 billion was invested on rural arterials and collectors, with 66.7 percent directed to system rehabilitation and 23.5 percent to expansion; the remainder was directed to system enhancement. Capital outlays on urban arterials and collectors were $51.2 billion, of which 58.7 percent was for system rehabilitation and 29.7 percent was for system expansion. Among the individual functional systems, rural major collectors had the highest percentage of highway capital outlay directed to system rehabilitation (77.4 percent), while urban other freeways and expressways had the lowest percentage directed for that purpose (49.4 percent).
Exhibit 2-13: Distribution of Capital Outlay by Improvement Type and Functional System, 2014
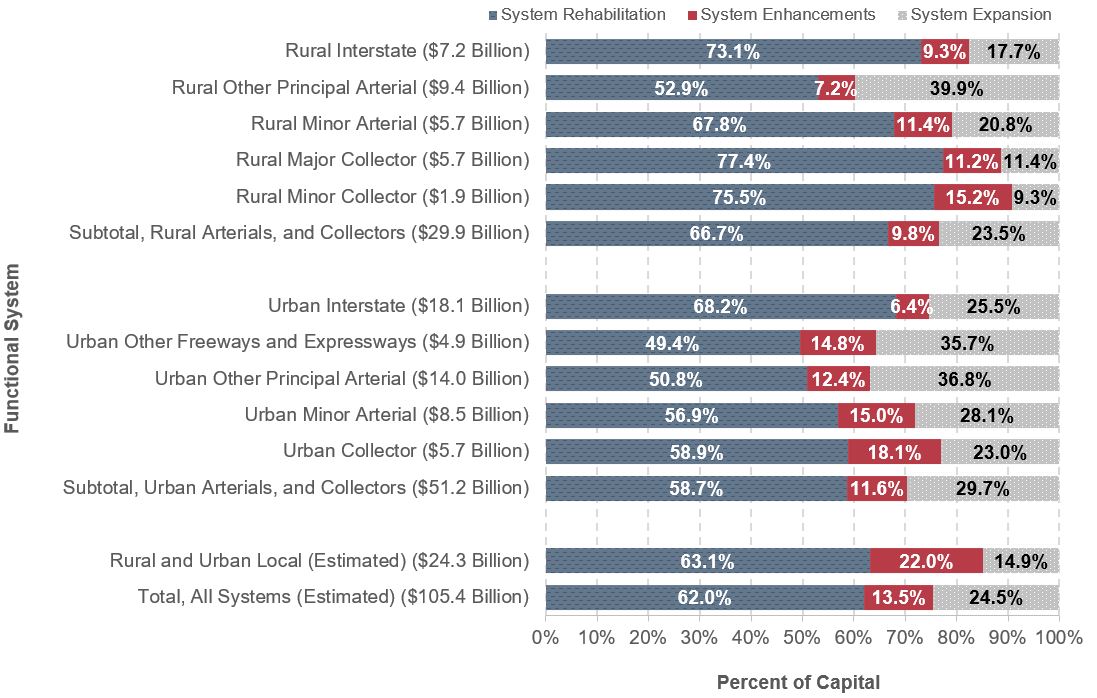
Sources: Highway Statistics 2014, Table SF-12A, and unpublished FHWA data.
Exhibit 2-14 shows trends in capital outlays by improvement type from 2004 to 2014. Each year, a majority of capital outlay was directed to rehabilitation, reflecting the need to preserve the aging system. The share of total capital spending for system rehabilitation, however, rose dramatically between 2008 and 2010, from 51.1 percent to 60.5 percent. System rehabilitation expenditures increased from $46.2 billion to $60.5 billion, nearly 31 percent over the two years. This dramatic increase was driven partly by the Recovery Act; one of the Recovery Act’s stated goals is to support jobs through construction expenditures, an aim best achieved by selecting projects that could be initiated and completed relatively quickly. This strategy led many States to direct a larger portion of their Recovery Act funding toward pavement improvement projects than they usually finance from regular Federal-aid funds in a typical year. However, even after the completion of most Recovery Act-funded projects, the overall share of highway capital spending directed to system preservation rose further to 62.0 percent in 2014. This suggests that the shift toward system preservation beginning in 2008 was likely driven by other factors in addition to the Recovery Act, and thus might represent the start of a long-term trend.
From 2004 to 2014, system rehabilitation expenditures grew at an average annual rate of 6.1 percent. System expansion expenditures decreased slightly at an average annual rate of 0.1 percent. This resulted in a decline in system expansion share of total capital outlays from 37.1 percent in 2004 to 24.5 percent in 2014. System enhancement expenditures grew from 11.2 percent of total capital outlays in 2004 to 13.5 percent in 2014.
Constant-Dollar Expenditures by Capital Improvement Type
Total capital outlay by all capital improvement types declined at an average annual rate of 0.1 percent from 2004 to 2014 in constant-dollar terms. Constant-dollar system rehabilitation expenditures rose by 1.7 percent per year over this period, while system expansion expenditures declined by 4.2 percent annually when adjusted for inflation. Expenditures for system enhancements grew by 1.8 percent per year in constant-dollar terms from 2004 to 2014.
Exhibit 2-14: Capital Outlay on All Roads by Improvement Type, 2004–2014
| Improvement Type | Capital Outlay, Billions of Dollars | Annual Rate of Change 2014/2004 |
|||||
|---|---|---|---|---|---|---|---|
| 2004 | 2006 | 2008 | 2010 | 2012 | 2014 | ||
| System Rehabilitation | |||||||
| Highway | $26.7 | $31.0 | $33.5 | $43.4 | $45.8 | $51.0 | 6.7% |
| Bridge | $9.6 | $10.3 | $12.7 | $17.0 | $16.4 | $14.4 | 4.1% |
| Subtotal | $36.3 | $41.3 | $46.2 | $60.5 | $62.2 | $65.4 | 6.1% |
| System Expansion | |||||||
| Additions to Existing Roadways | $12.1 | $14.0 | $15.7 | $15.0 | $14.0 | $13.2 | 0.9% |
| New Routes | $12.6 | $15.2 | $16.1 | $11.4 | $12.1 | $11.0 | -1.3% |
| New Bridges | $1.4 | $1.2 | $1.5 | $0.9 | $1.1 | $1.6 | 1.2% |
| Subtotal | $26.1 | $30.4 | $33.3 | $27.4 | $27.2 | $25.9 | -0.1% |
| System Enhancements | $7.8 | $8.5 | $10.9 | $12.2 | $15.9 | $14.2 | 6.1% |
| Total | $70.3 | $80.2 | $90.4 | $100.0 | $105.3 | $105.4 | 4.1% |
| Percent of Total Capital Outlay | |||||||
| System Rehabilitation | 51.7% | 51.5% | 51.1% | 60.5% | 59.0% | 62.0% | |
| System Expansion | 37.1% | 37.9% | 36.9% | 27.4% | 25.8% | 24.5% | |
| System Enhancements | 11.2% | 10.6% | 12.0% | 12.2% | 15.1% | 13.5% | |
Sources: Highway Statistics, various years, Table SF-12A, and unpublished FHWA data.
Capital Outlays on Federal-aid Highways
As discussed in Chapter 1, “Federal-aid highways” includes all roads except those in functional classes that are generally ineligible for Federal funding: rural minor collector, rural local, or urban local. Exhibit t2-15 shows that total capital outlays on Federal-aid highways increased at an average annual rate of 3.9 percent from 2004 to 2014, rising to $79.3 billion in 2014.
The share of capital outlay on Federal-aid highways directed to system rehabilitation in 2014 was 61.4 percent, below the comparable percentage for all roads of 62.0 percent (see Exhibit 2-14). This pattern is consistent with that from 2004 to 2012 as well; in each year, the portion of Federal-aid highway capital outlay directed toward system rehabilitation and system enhancements was lower than the comparable shares for all roads, whereas the portion directed toward system expansion was higher than for all roads.
Exhibit 2-15: Capital Outlay on Federal-aid Highways by Improvement Type, 2004–2014
| Improvement Type | Capital Outlay, Billions of Dollars | Annual Rate of Change 2014/2004 |
|||||
|---|---|---|---|---|---|---|---|
| 2004 | 2006 | 2008 | 2010 | 2012 | 2014 | ||
| System Rehabilitation | |||||||
| Highway | $19.4 | $22.9 | $26.1 | $33.1 | $34.5 | $38.1 | 7.0% |
| Bridge | $7.2 | $7.7 | $9.3 | $12.5 | $12.0 | $10.5 | 3.9% |
| Subtotal | $26.6 | $30.6 | $35.5 | $45.6 | $46.5 | $48.6 | 6.2% |
| System Expansion | |||||||
| Additions to Existing Roadways | $11.6 | $12.9 | $14.3 | $13.8 | $12.8 | $12.3 | 0.7% |
| New Routes | $9.8 | $12.0 | $12.8 | $8.8 | $9.3 | $8.5 | -1.5% |
| New Bridges | $1.2 | $0.9 | $1.0 | $0.7 | $0.8 | $1.2 | 0.7% |
| Subtotal | $22.6 | $25.9 | $28.1 | $23.3 | $22.9 | $22.1 | -0.2% |
| System Enhancements | $5.0 | $5.5 | $6.4 | $6.8 | $9.6 | $8.6 | 5.4% |
| Total | $54.2 | $61.9 | $70.0 | $75.7 | $79.0 | $79.3 | 3.9% |
| Percent of Total Capital Outlay | |||||||
| System Rehabilitation | 49.1% | 49.3% | 50.7% | 60.3% | 58.9% | 61.4% | |
| System Expansion | 41.6% | 41.9% | 40.1% | 30.8% | 29.0% | 27.8% | |
| System Enhancements | 9.3% | 8.8% | 9.2% | 9.0% | 12.1% | 10.8% | |
Sources: Highway Statistics, various years, Table SF-12A, and unpublished FHWA data.
Capital Outlays on the NHS
The NHS comprises roads essential to the Nation’s economy, defense, and mobility, as described in Chapter 1. The NHS was expanded under MAP-21 from 4.0 percent of the Nation’s highway mileage to approximately 5.4 percent. Exhibit 2-16 shows that capital outlays for the NHS amounted to $56.3 billion in 2014. System rehabilitation expenditures of 34.1 billion were the largest amount, followed by system expansion at $17.0 billion and system enhancements at $5.2 billion.
Exhibit 2-16: Capital Outlay on the National Highway System by Improvement Type, 2004–20141
| Improvement Type | Capital Outlay, Billions of Dollars | Annual Rate of Change 2014/2004 |
|||||
|---|---|---|---|---|---|---|---|
| 2004 | 2006 | 2008 | 2010 | 2012 | 2014 | ||
| System Rehabilitation | |||||||
| Highway | $9.5 | $12.3 | $14.9 | $19.9 | $19.7 | $27.0 | 11.0% |
| Bridge | $4.0 | $4.3 | $5.4 | $7.4 | $6.7 | $7.1 | 5.9% |
| Subtotal | $13.5 | $16.6 | $20.4 | $27.3 | $26.4 | $34.1 | 9.7% |
| System Expansion | |||||||
| Additions to Existing Roadways | $7.1 | $8.1 | $9.2 | $8.6 | $8.0 | $9.2 | 2.7% |
| New Routes | $6.8 | $8.9 | $8.6 | $4.7 | $5.6 | $6.7 | -0.2% |
| New Bridges | $0.9 | $0.7 | $0.6 | $0.3 | $0.5 | $1.1 | 1.6% |
| Subtotal | $14.8 | $17.7 | $18.3 | $13.7 | $14.1 | $17.0 | 1.4% |
| System Enhancements | $2.8 | $2.8 | $3.3 | $3.4 | $4.0 | $5.2 | 6.4% |
| Total | $31.1 | $37.2 | $42.0 | $44.4 | $44.6 | $56.3 | 6.1% |
| Percent of Total Capital Outlay | |||||||
| System Rehabilitation | 43.5% | 44.7% | 48.5% | 61.6% | 59.3% | 60.6% | |
| System Expansion | 47.6% | 47.7% | 43.7% | 30.8% | 31.7% | 30.2% | |
| System Enhancements | 8.9% | 7.6% | 7.8% | 7.6% | 9.0% | 9.2% | |
1 The NHS was expanded under MAP-21 from 4.0 percent of the Nation's highway mileage to approximately 5.4 percent. For 2014, all spending on principal arterials was assumed to have occurred on the NHS.
Sources: Highway Statistics, various years, Table SF-12B, and unpublished FHWA data.
Over the 10-year period beginning in 2004, the share of system rehabilitation on the NHS jumped from 43.5 percent to 60.6 percent while the share of system expansion expenditures declined from 47.6 percent to 30.2 percent of total capital outlays. During the same period, the share of system enhancements on the NHS increased slightly from 8.9 percent to 9.2 percent.
Capital Outlays on the Interstate System
Exhibit 2-17 shows that from 2004 to 2014, capital outlay increased annually on average by 6.3 percent on the Interstate System, to $25.3 billion, well above the 4.1-percent annual increase observed for all roads. This increase is also much higher than the average annual increase in capital outlay for all Federal-aid highways of 3.9 percent observed from 2004 to 2014.
Exhibit 2-17: Capital Outlay on the Interstate System, by Improvement Type, 2004–2014
| Improvement Type | Capital Outlay, Billions of Dollars | Annual Rate of Change 2014/2004 |
|||||
|---|---|---|---|---|---|---|---|
| 2004 | 2006 | 2008 | 2010 | 2012 | 2014 | ||
| System Rehabilitation | |||||||
| Highway | $4.7 | $5.8 | $7.5 | $9.4 | $8.9 | $14.4 | 11.9% |
| Bridge | $2.3 | $2.5 | $3.3 | $4.1 | $3.8 | $3.2 | 3.4% |
| Subtotal | $7.0 | $8.3 | $10.8 | $13.5 | $12.7 | $17.6 | 9.7% |
| System Expansion | |||||||
| Additions to Existing Roadways | $2.9 | $3.2 | $4.5 | $3.5 | $3.4 | $3.8 | 2.6% |
| New Routes | $2.5 | $3.5 | $3.0 | $1.7 | $2.7 | $1.7 | -3.9% |
| New Bridges | $0.2 | $0.3 | $0.3 | $0.1 | $0.2 | $0.4 | 8.0% |
| Subtotal | $5.6 | $7.1 | $7.8 | $5.3 | $6.3 | $5.9 | 0.5% |
| System Enhancements | $1.1 | $1.2 | $1.4 | $1.4 | $1.5 | $1.8 | 4.9% |
| Total | $13.7 | $16.5 | $20.0 | $20.2 | $20.5 | $25.3 | 6.3% |
| Percent of Total Capital Outlay | |||||||
| System Rehabilitation | 50.8% | 49.9% | 53.9% | 66.7% | 62.1% | 69.6% | |
| System Expansion | 40.9% | 42.6% | 38.9% | 26.3% | 30.5% | 23.2% | |
| System Enhancements | 8.3% | 7.4% | 7.1% | 6.9% | 7.3% | 7.2% | |
Sources: Highway Statistics, various years, Table SF-12A, and unpublished FHWA data.
The share of Interstate capital outlay directed to system rehabilitation in 2014 was 69.6 percent, higher than the comparable percentages for the NHS, Federal-aid highways, and all roads. This pattern is largely consistent with that from 2004 to 2012; the share of Interstate capital outlay directed to system rehabilitation was higher in each year from 2004 to 2012 than comparable percentages for the NHS or Federal-aid highways, although in some years it was lower than the comparable percentage for all roads. The share of Interstate capital outlay directed toward system enhancements was lower in each year from 2004 to 2014 than comparable percentages for all roads, Federal-aid highways, and the NHS.
Project Finance
Project finance refers to specific techniques and tools that supplement traditional highway funding methods, improving governments’ ability to deliver transportation projects. In recent years, State and local transportation agencies have adopted new ways of financing and delivering transportation projects. In the face of stagnating public revenues and demanding fiscal requirements, many jurisdictions are relying on options such as public-private partnerships, Federal credit assistance, and other debt-financing tools. These strategies could enable public agencies to transfer certain project delivery risks and deliver infrastructure projects earlier than would be possible through traditional mechanisms.
Public-Private Partnerships
Public-private partnerships (P3s) are contractual agreements between a public agency and a private entity that allow for greater private-sector participation in the delivery and financing of transportation projects. Typically, this participation involves the private entity’s assuming additional project risks, such as design, finance, long-term operation, maintenance, or traffic and revenue. P3 delivery methods can be classified as “design-build,” “operate-maintain,” “design-build-operate-maintain,” “design-build-finance,” and “design-build-finance-operate-maintain.” The most common type of public-private partnership is the “design-build” agreement, in which a private entity agrees to design and build a highway. Each method can offer advantages or disadvantages, depending on the specific project and parties involved. P3s are undertaken for a variety of purposes, including monetizing the value of existing assets, developing new transportation facilities, or rehabilitating or expanding existing facilities. Although P3s offer certain advantages, such as increased financing capacity and reduced upfront costs, the public sector still must identify a source of revenue for the project to provide a return to the private partner’s investment and must ensure that the goals and interests of the public are adequately secured. Due to the inherent complexity of P3 agreements and the scale of the transportation projects involved, many States have adopted specific enabling legislation for these arrangements (a summary report developed by the National Conference of State Legislatures on these statutes is available at (http://www.ncsl.org/Portals/1/Documents/transportation/P3_State_Statutes.pdf). Additional information on P3s is available at (https://www.fhwa.dot.gov/ipd/p3/index.htm).
Public-Private Partnership Project:
U.S. 36 Express Lanes (Phase 2)
U.S. 36 is a four-lane divided highway that connects the City of Boulder to Denver, Colorado, at its intersection with I-25. The U.S. 36 Express Lanes Phase 2 project extends the 10-mile Phase 1 express lane facility five miles further northwest to Boulder and includes one express, high-occupancy toll lane in each direction, replacement of the Coal Creek Bridge, rehabilitation and widening of the South Boulder Creek Bridge, and widening of the McCaslin Boulevard Bridge, bus rapid transit improvements, bikeway along much of the corridor, and intelligent transportation system equipment for tolling, transit information, and incident management. This project is delivered as a design, build, finance, operate, and maintain public-private partnership.
The $208.4-million project is financed by $133.2 million in private funding and $64.4 million in public funding. It includes a mixture of private capital, a Transportation Infrastructure Finance and Innovation Act (TIFIA) loan, private activity bonds, equity, toll revenues, local, State and Federal funding, and sales tax revenue. The concession agreement was finalized in 2012 between the Colorado High Performance Transportation Enterprise (HPTE) and Plenary Roads Finco LP. HPTE awarded the concession in April 2013. The concession also includes the operations and maintenance of the Phase 1 portion of the express lanes. Phase 2 opened to traffic in January 2016 and tolling began in March 2016. The concession period extends for 50 years. The P3 arrangement enabled the project to be completed years sooner than originally planned.
Debt-Financing Tools
Some transportation projects are so large that their cost exceeds available current grant funding and tax receipts or would consume so much of these current funding sources that they would delay many other planned projects. For this reason, State and local governments often seek financing for large projects through borrowing, which provides an immediate influx of cash to fund project construction costs. The borrower then retires the debt by making principal and interest payments over time. Tax-exempt municipal bonds, backed by future government revenues, are the most common method of borrowing by government agencies for transportation projects.
A Grant Anticipation Revenue Vehicle (GARVEE) is a debt-financing instrument that can generate initial capital for major transportation projects. Future Federal-aid funds are used to repay the debt and related financing costs under the provisions of Section 122 of Title 23, U.S. Code. GARVEEs enable a State to accelerate construction timelines and spread the cost of a transportation facility over its useful life rather than just the construction period. As of December 2016, 25 States and three U.S. territories had issued approximately $20.4 billion in GARVEEs.
Private activity bonds (PABs) provide additional borrowing opportunities. PABs are debt instruments issued by State or local governments on behalf of a private entity, allowing a private project sponsor to benefit from the lower financing costs of tax-exempt municipal bonds. In 2005, Federal legislation provided a special authorization for up to $15 billion in PABs for highway and freight transfer projects, with allocations approved by DOT. As of January 2017, nearly $6.6 billion in these PABs had been issued for 17 projects.
Additional information on Federal debt-financing tools is available at (https://www.fhwa.dot.gov/ipd/finance/tools_programs/federal_debt_financing/index.htm).
Debt-Financing Tools: Ohio River Bridges Downtown Crossing—Louisville, Kentucky/Southern Indiana
The Downtown Crossing project includes the new Abraham Lincoln Bridge across the Ohio River and associated roadway and facilities, connecting Louisville, Kentucky, with Clark County, Indiana. The bridge carries six lanes of northbound I-65. The project also includes improved and expanded approaches and the reconstruction of the Kennedy Interchange between I-65, I-64, and I-71 in downtown Louisville.
The Louisville and Southern Indiana Bridges Authority, a bi-State agency, has been responsible for the financing of the $2.8 billion Ohio River Bridges. The Downtown River Bridge is tolled, which will back bonds to partially finance the project.
The project cost of $1,478 million, including financing and interest, is funded by:
- GARVEE bonds - $337 million;
- Project revenue bonds - $272 million;
- TIFIA loan - $452 million;
- Bond Anticipation Notes - $41 million;
- Federal and State funds (Kentucky) - $342 million;
- Federal and State funds (Indiana) - $34 million
These innovative delivery approaches have allowed for significant cost savings. Project construction began in June 2013. The Abraham Lincoln Bridge opened to traffic December 2015.
Federal Credit Assistance
Federal credit assistance for highway improvements can take one of two forms: (1) loans, where project sponsors borrow Federal funds from a State department of transportation or the Federal government; and (2) credit enhancements, where a State department of transportation or the Federal government makes Federal funds available on a contingent (or standby) basis. Loans can provide the capital necessary to proceed with a project and reduce the amount of capital borrowed from other sources. Credit enhancement helps reduce risk to investors and thus allows project sponsors to borrow at lower interest rates. Loans also might serve a credit enhancement function by reducing the risk borne by other investors. Federal tools currently available to project sponsors include the TIFIA Credit Program, State Infrastructure Banks (SIBs) programs, and Section 129 (U.S.C. 129 (A)(7)) loans.
The TIFIA Credit Program provides Federal credit assistance in the form of direct loans, loan guarantees, and standby lines of credit to finance surface transportation projects of national and regional significance. A TIFIA project must pledge repayment in whole or in part with dedicated revenue sources, such as tolls, user fees, special assessments (taxes), or other non-Federal sources.
SIBs enable States to use their Federal apportionments to establish a revolving fund that, much like a bank, can offer low-cost loans and other credit assistance to help finance highway and transit projects. As of September 2016, 33 States and territories had entered into an estimated 834 SIB loan agreements for a total of $5.9 billion.
Section 129 loans allow States to use regular Federal-aid highway apportionments to fund loans to toll and nontoll projects, which can be paid back with dedicated revenue streams. Because loan repayments can be delayed until five years after project completion, this mechanism provides flexibility during the ramp-up period of a new facility.
The DOT Build America Bureau streamlines credit opportunities and grants and provides access to the various credit and grant programs. Additional information on credit assistance tools is available at (https://www.fhwa.dot.gov/innovativeprograms/centers/innovative_finance/).
Key Takeaways
- Capital and operating expenses in 2014 totaled $65.2 billion, including $17.7 billion for capital and $47.5 billion for operating expenses.
- Passenger fares contributed $16.5 billion, or 25%. Other directly generated funds such as parking revenues, concessions, and other sources contributed $2.7 billion, or 4%.
- Public assistance accounted for 71% of all funds, of which Federal funds accounted for 25%, State for 31%, and local by 43%.
- Capital investment grew at an average of 1.0% per year, from $15.8 billion in 2004 to $17.4 billion in 2014.
- Capital investment in rehabilitation of existing assets and expansion in 2014 were $12.8 billion and $4.6 billion, respectively, a 73/27% split ratio. In 2004, the ratio was 70/30%.
- Financial Indicators of the Top 10 agencies
- The average recovery ratio (fare revenues per total operating expenses) of the top 10 transit agencies decreased slightly from 33.9% in 2004 to 32.7% in 2014.
- Average fare revenues per mile increased by 19%, from $4.4 per mile in 2004 to $5.2 per mile in 2014 (constant dollars).
- Operating cost per mile increased by 23%, from $12.9 per mile in 2004 to $15.9 per mile in 2014. Average labor costs for the top 10 transit agencies increased by 0.9%, from $9.3 per mile in 2004 to $9.4 per mile in 2014.
Transit Funding
Transit funding comes from two major sources: (1) public funds allocated by Federal, State, and local governments, and (2) system-generated revenues earned from providing transit services. As shown in Exhibit 2-18, $65.3 billion was available for transit funding in 2014. Federal funding for transit includes fuel taxes dedicated to transit from the Mass Transit Account of the Highway Trust Fund (HTF) and General Fund appropriations. State and local governments also provide funding for transit from their General Fund appropriations and from fuel, income, sales, property, and other taxes, specific percentages of which can be dedicated to transit. These percentages vary considerably among taxing jurisdictions and by type of tax. Other public funds, from toll revenues and other sources, also might be used to fund transit. Passenger fares principally comprise system-generated revenues, although transit systems earn additional revenues from advertising and concessions, park-and-ride lots, investment income, and rental of excess property and equipment.
Level and Composition of Transit Funding
Exhibit 2-19 breaks down the sources of total urban and rural transit funding. In 2014, public funds of $46.1 billion were available for transit, accounting for 73 percent of total transit funding. Of this amount, Federal funding was $11.6 billion or 25 percent of total public funding and 18 percent of all funding from both public and nonpublic sources. State funding was $14.5 billion, accounting for 31 percent of total public funds and 22 percent of all funding. Local jurisdictions provided the bulk of transit funds at $20.0 billion in 2014, or 43 percent of total public funds and 31 percent of all funding. System-generated revenues were $19.2 billion, or 29 percent of all funding.
Exhibit 2-18: Revenue Sources for Transit Funding, 2014
| Revenue Sources (Millions of Dollars) | Percent | |||||
|---|---|---|---|---|---|---|
| Directly Generated Funds | Federal | State | Local | Total | ||
| Public Funds | 11,557 | 14,505 | 20,047 | 46,109 | 71% | |
| General Fund | 2,311 | 3,979 | 4,870 | 11,160 | 17% | |
| Fuel Tax | 9,245 | 1,011 | 193 | 10,450 | 16% | |
| Income Tax | 459 | 108 | 568 | 1% | ||
| Sales Tax | 3,914 | 6,207 | 10,121 | 16% | ||
| Property Tax | 15 | 518 | 533 | 1% | ||
| Other Dedicated Taxes | 2,644 | 89 | 2,733 | 4% | ||
| Other Public Funds | 263 | 1,135 | 1,398 | 2% | ||
| System-Generated Revenue | 19,185 | 19,185 | 29% | |||
| Passenger Fares | 16,469 | 16,469 | 25% | |||
| Other Revenue | 2,716 | 2,716 | 4% | |||
| Total All Sources | 65,294 | 100% | ||||
Source: National Transit Database.
Exhibit 2-19: Public Transit Revenue Sources, 2014 Fund Highway Account Receipts and Outlays, Fiscal Years 2000–2016
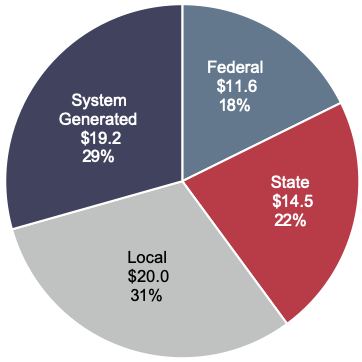
Note: Revenue in billions of dollars
Source: National Transit Database
How long has it been since excise tax revenue deposited into the Mass Transit Account exceeded expenditures
The last time annual net receipts credited to the Mass Transit Account of the HTF exceeded annual expenditures from the Mass Transit Account was 2007. As shown in Exhibit 2-20, for nine of the 11 years since 2004, total annual receipts to the Mass Transit Account from excise taxes and other income (including amounts transferred from the Highway Account) have been lower than the annual expenditures from the Mass Transit Account. The gap between Mass Transit Account outlays and receipts increased by about 10 percent from both 2012 to 2013 and 2013 to 2014, respectively.
Exhibit 2-20: Mass Transit Account Receipts and Outlays, Fiscal Years 2004–2014
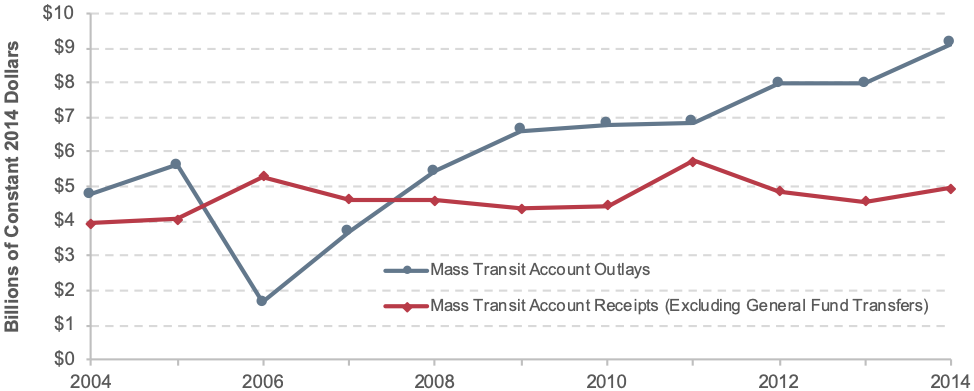
1 As shown in 2014 constant dollars. Note: Prior to 2006 Mass Transit Account funds were immediately transferred to the General Fund at the time funds were obligated for expenditures in future years. Starting in 2006, Mass Transit account funds were not transferred until the year in which expenditures by transit agencies were made. This accounting change resulted in a dip in outlays in 2006.
Sources: Highway Statistics, various years, Tables FE-210 (https://www.fhwa.dot.gov/policyinformation/statistics/2014/fe210.cfm) and FE-10 (https://www.fhwa.dot.gov/policyinformation/statistics/2014/fe10.cfm).
Federal Funding
Federal funding for transit comes from two sources: the general revenues of the U.S. government, and revenues generated from fuel taxes credited to the Mass Transit Account of the HTF. The largest part of transit funding from the HTF is distributed by formula, which is legislatively defined. A smaller part is distributed competitively or at agency discretion.
General revenue sources include income taxes, corporate taxes, tariffs, fees, and other government income not required by statute to be accounted for in a separate fund. The Mass Transit Account is generally the largest source of Federal funding for transit, although in 2009 the Mass Transit Account contribution was surpassed by Recovery Act funds from the General Fund. Exhibit 2-21 shows how Recovery Act funds were awarded in 2009, 2010, and 2011 compared with other Federal funding from the Mass Transit Account and the General Fund. Of the funds authorized for transit grants in the Federal Transit Administration’s (FTA) 2012 budget, 81.0 percent were derived from the Mass Transit Account. Funding from the Mass Transit Account in nominal dollars increased from $0.5 billion in 1983 to $12.8 billion in 2012.
Exhibit 2-21: Recovery Act Funding Awards Compared to Other FTA Fund Awards
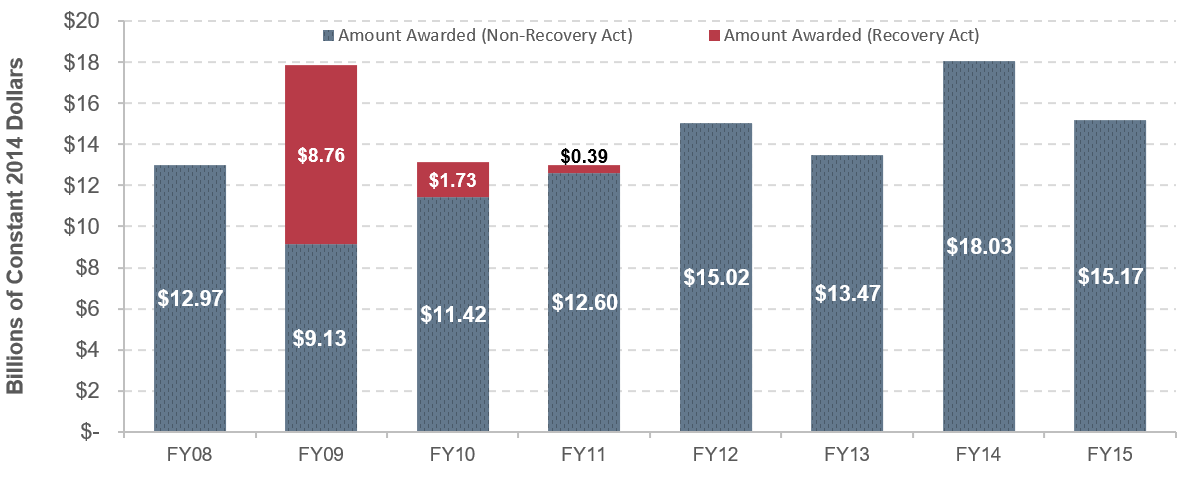
Source: Federal Transit Administration, Grants Data (https://www.fhwa.dot.gov/policyinformation/statistics/2014/fe210.cfm).
Since 1973, Federal statutes authorizing surface transportation have contained flexible funding provisions that enable transfers from certain highway funds to transit programs and vice versa. Transfers are subject to State and regional/local discretion, and priorities are established through statewide transportation planning processes. All States participate in the flexible funding program, except Arkansas, Delaware, Hawaii, Nebraska, North Dakota, South Dakota, and Wyoming. U.S. territories, including American Samoa, Guam, the Northern Mariana Islands, Puerto Rico, and the Virgin Islands, also do not participate. Flexible funding transferred from highways to transit fluctuates from year to year and is drawn from several different sources.
The Surface Transportation Block Grant Program is the primary source of Federal Highway Administration (FHWA) funds that are “flexed” to the FTA to pay for transit projects. Funding is up to 80 percent of the eligible project costs and may be used for all capital and maintenance projects eligible for funds under current FTA programs. These funds may not be used for operating assistance.
FHWA’s Congestion Mitigation and Air Quality (CMAQ) Improvement Program funds are another source of flexed funds used to support transit projects in air quality nonattainment areas. A CMAQ project must contribute to the attainment of the National Ambient Air Quality Standards by reducing air pollutant emissions from transportation sources. Public transportation projects can be funded through CMAQ, which also includes some provision for transit operating assistance.
State and Local Funding
General funds and other dedicated public funds (vehicle licensing and registration fees, communications access fees, surcharges and taxes, lottery and casino receipts, and proceeds from property and asset sales) are important sources of funding for transit at both the State and local levels. State and local funding sources for transit are shown in Exhibit 2-22. Taxes, including fuel, sales, income, property, and other dedicated taxes, provide 44.8 percent of public funds for State and local sources. General funds provide 26 percent of transit funding, and other public funds provide the remaining 30 percent.
Exhibit 2-22: State and Local Sources of Urban Transit Funding
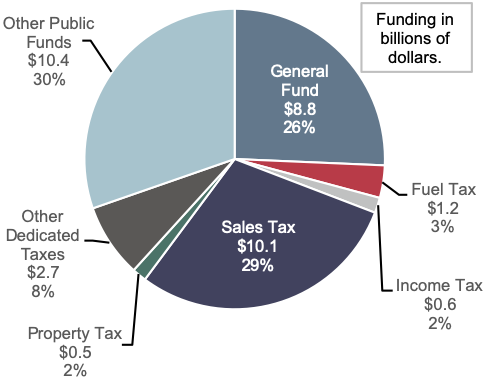
Source: National Transit Database
System-Generated Funds
In 2014, system-generated funds were $19.2 billion and provided 29.4 percent of total transit funding. Passenger fares contributed $16.5 billion, accounting for 25.2 percent of total transit funds. These passenger fare figures do not include payments by State entities to transit systems that offset reduced transit fares for certain segments of the population, such as students and the elderly. These payments are included in the “other revenue” category.
Trends in Funding
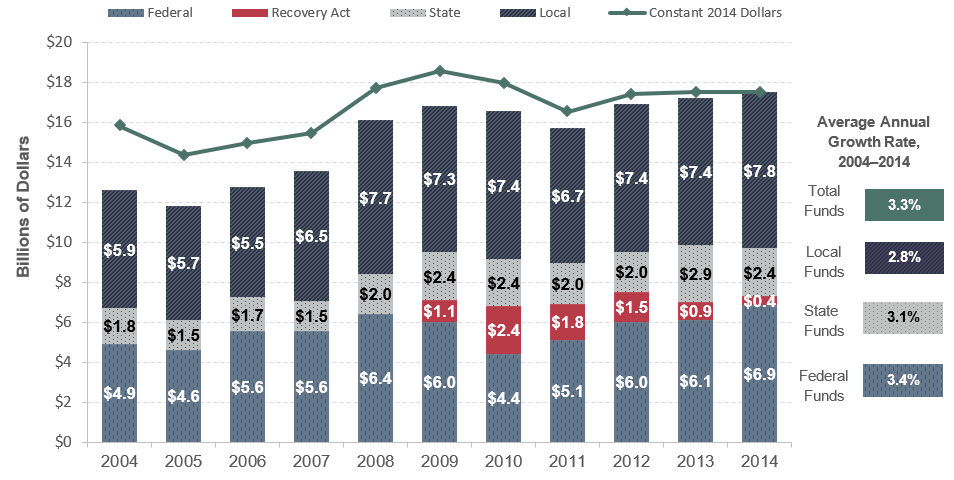
Between 2004 and 2014, public funding for transit increased at an average annual rate of 2.6 percent, Federal funding increased at an average annual rate of 2.5 percent, and State and local funding increased at an average annual rate of 2.9 percent after adjusting for inflation (constant dollars). These data are presented in Exhibit 2-23..
Federal funding for transit, as a percentage of total funding for transit from Federal, State, and local sources combined, reached a peak of 43 percent in the late 1970s, and declined to near its present value by the early 1990s. State and local funding increased during this same period. Exhibit 2-23 shows that, since 2004, the Federal government has provided between 17 and 19 percent of total funding for transit (including system-generated funds). In 2014, it provided 17 percent.
Exhibit 2-23: Funding for Urban Transit by Government Jurisdiction, 2004–2014
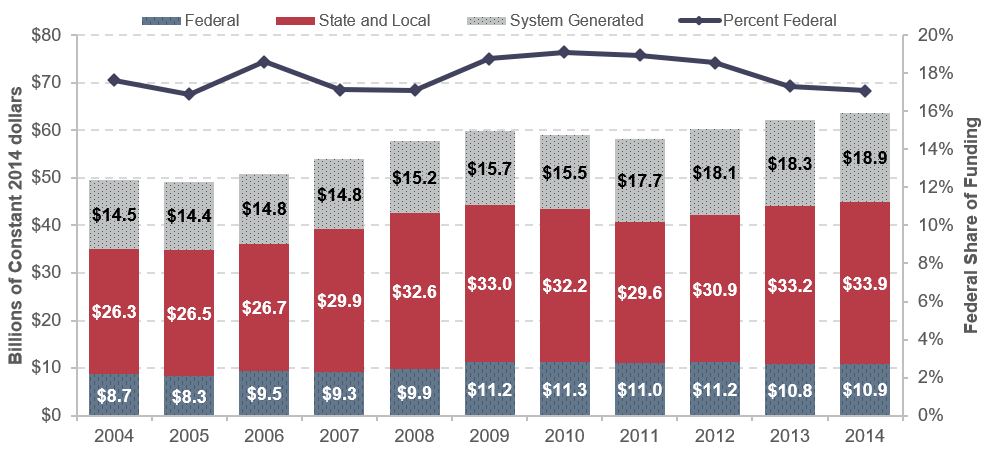
Source: National Transit Database
Funding in Current and Constant Dollars
Public funding for transit in current dollars and constant (adjusted for inflation) dollars since 1993 is presented in Exhibit 2-24. Total public funding for transit was $45.3 billion in 2014. In constant dollar terms, this amount was 4 percent lower than in 2010. Between 2012 and 2014, Federal funding stayed nearly constant at around $10.9 billion in current dollars. In constant dollars, however, this represents a 2.7 percent decrease in funding. From 2012 to 2014, in current dollars, State and local funding increased from $29.9 billion to $34.4 billion (15 percent). In constant dollars, this represents an 11-percent increase in funding.
Federal funds directed to capital expenditures increased by 4.5 percent from 2004 to 2014, while capital funds applied to operating expenditures increased by 8.4 percent during the same period (constant dollars). As indicated in Exhibit 2-25, $2.5 billion was applied to operating expenditures and $7.4 billion was applied to capital expenditures in 2014. More than half the operating expenditures were for preventive maintenance, which is reimbursed as a capital expense under FTA’s 5307 grant program.
Exhibit 2-24: Current and Constant Dollar Public Funding for Public Transportation (All Sources)
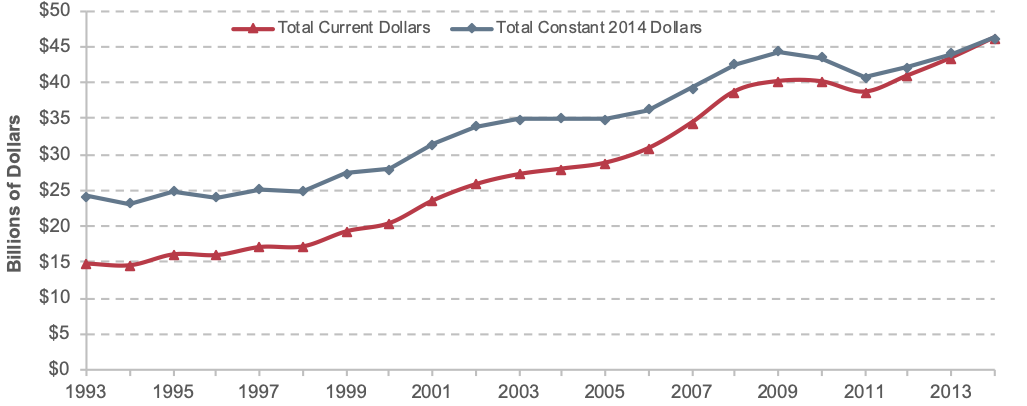
Note: Constant dollars based on Consumer Price Index.
Source: National Transit Database
Exhibit 2-25: Applications of Federal Funds for Transit Operating and Capital Expenditures, 2004–2014
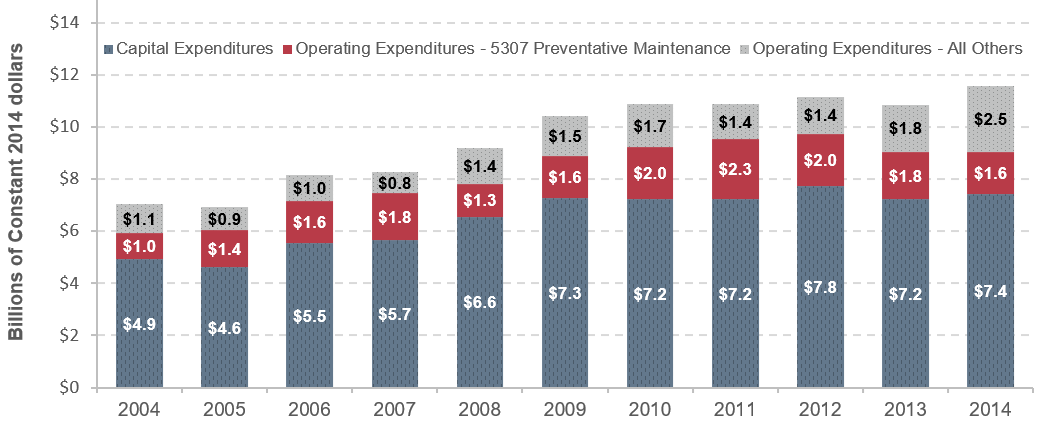
Source: National Transit Database
Capital Funding and Expenditures
Funding for capital investments by transit operators in the United States comes primarily from public sources. A relatively small amount of private-sector funding for capital investment in transit projects is generated through innovative finance programs.
Capital investments include the design and construction of new transit systems, extensions of existing systems, and the modernization or replacement of existing assets. Capital investment expenditures can be made for the acquisition, renovation, and repair of vehicles (e.g., buses, railcars, locomotives, and service vehicles) or fixed assets (e.g., guideway elements, track, stations, and maintenance and administrative facilities).
As shown in Exhibit 2-26, total public transit agency expenditures for capital investment were $17.7 billion in 2014. This expenditure accounted for 28 percent of total available funds for transit. Federal funds provided $6.9 billion in 2014, accounting for 39.5 percent of total transit agency capital expenditures. State funds provided 13.7 percent and local funds provided 44.3 percent of total transit funding. Recovery Act funds provided the remaining 2.5 percent of revenues for agency capital expenditures in 2014 (constant dollars).
Exhibit 2-26: Sources of Funds for Transit Capital Expenditures, 2004–2014
1 Data prior to 2007 do not include rural
expenditures.
Source: National Transit Database
From 2009 to 2012, substantial amounts of Recovery Act funds were expended, and non-Recovery Act Federal funds decreased compared with levels in previous years. This decrease in the use of other Federal funds was likely related to the strict 2-year obligation limit specified for Recovery Act funds: these funds had to be used first due to their short period of availability. In 2012 and thereafter, as most of the Recovery Act funds had been expended, expenditures using non-Recovery Act Federal funds returned to pre-2009 levels. Federal funding from 2004 to 2014 grew faster than did State or local funding.
As shown in Exhibit 2-27, rail modes consume a higher percentage of total transit capital investment than fixed-route bus modes for two reasons: (1) the higher cost of building fixed guideways and rail stations, and (2) fixed-route bus systems typically do not pay to build or maintain the roads on which they run. In 2014, $12.8 billion, or 72.3 percent of total transit capital expenditures, were invested in rail modes of transportation, compared with $4.6 billion, or 26.1 percent of the total, which was invested in nonrail modes. This investment distribution has been consistent over the past decade.
Exhibit 2-27: Urban Transit Capital Expenditures by Mode and Type, 2014
| Rail Capital Expenditures, in Millions | ||||||||
|---|---|---|---|---|---|---|---|---|
| Type | Commuter Rail | Heavy Rail | Light Rail | Hybrid Rail | Streetcar Rail | Other Rail1 | Total Rail | |
| Guideway | $1,202 | $1,907 | $3,033 | $1 | $110 | $34 | $6,287 | |
| Rolling Stock | $663 | $682 | $307 | $1 | $42 | $10 | $1,704 | |
| Systems | $393 | $692 | $226 | $1 | $2 | $20 | $1,333 | |
| Maintenance Facilities | $125 | $226 | $116 | $0 | $21 | $1 | $490 | |
| Stations | $312 | $1,656 | $222 | $10 | $5 | $3 | $2,208 | |
| Fare Revenue Collection Equipment | $24 | $24 | $13 | $0 | $2 | $0 | $63 | |
| Administrative Buildings | $13 | $59 | $1 | $0 | $0 | $0 | $73 | |
| Other Vehicles | $10 | $22 | $8 | $0 | $3 | $3 | $46 | |
| Other Capital Expenditures2 | $64 | $440 | $11 | $1 | $49 | $5 | $570 | |
| Total | $2,807 | $5,708 | $3,936 | $15 | $233 | $76 | $12,774 | |
| Percentage of Total | 15.9% | 32.3% | 22.3% | 0.1% | 1.3% | 0.4% | 72.3% | |
| Nonrail Capital Expenditures, in Millions | ||||||||
| Type | Fixed-Route Bus | Bus Rapid Transit | Commuter Bus | Demand Response | Ferryboat | Trolley Bus | Vanpool | Total Nonrail |
| Guideway | $99 | $35 | $14 | $0 | $0 | $6 | $0 | $154 |
| Rolling Stock | $2,150 | $16 | $119 | $176 | $139 | $10 | $34 | $2,644 |
| Systems | $324 | $8 | $6 | $21 | $1 | $6 | $0 | $365 |
| Maintenance Facilities | $553 | $3 | $13 | $12 | $6 | $0 | $0 | $586 |
| Stations | $268 | $7 | $14 | $0 | $103 | $1 | $0 | $394 |
| Fare Revenue Collection Equipment | $95 | $4 | $0 | $3 | $0 | $0 | $0 | $102 |
| Administrative Buildings | $121 | $0 | $0 | $6 | $0 | $1 | $0 | $129 |
| Other Vehicles | $40 | $0 | $0 | $2 | $5 | $0 | $0 | $47 |
| Other Capital Expenditures2 | $177 | $4 | $2 | $10 | $1 | $0 | $0 | $195 |
| Total | $3,827 | $77 | $169 | $229 | $255 | $24 | $35 | $4,617 |
| Percentage of Total | 21.7% | 0.4% | 1.0% | 1.3% | 1.4% | 0.1% | 0.2% | 26.1% |
| Total Expenditures for Rail and Nonrail Modes, in Millions | ||||||||
| Type | Total Rail and Nonrail | Percent of Total | ||||||
| Guideway | $6,441 | 36.4% | ||||||
| Rolling Stock | $4,349 | 24.6% | ||||||
| Systems | $1,698 | 9.6% | ||||||
| Maintenance Facilities | $1,076 | 6.1% | ||||||
| Stations | ||||||||
| Fare Revenue Collection Equipment | $164 | 0.9% | ||||||
| Administrative Buildings | $202 | 1.1% | ||||||
| Other Vehicles | $93 | 0.5% | ||||||
| Other Capital Expenditures2 | $765 | 4.3% | ||||||
| Agencies operating less than 30 peak vehicles3 | $283 | 1.6% | ||||||
| Guideway | $6,441 | 36.4% | ||||||
| Rolling Stock | $4,349 | 24.6% | ||||||
| Total | $17,674 | 100.0% | ||||||
1 Includes Alaska railroad, cable car, inclined plane, and monorail/automated guideway.
2 Capital expenditures not elsewhere included. These expenditures include furniture and equipment that are not an integral part of buildings and structures; they also include shelters, signs, and passenger amenities (e.g., benches) not in passenger stations.
3 Agencies operating fewer than 30 peak vehicles do not report capital data by mode and type of expenditure.
Note: Table does not include aerial tramway, demand taxi, or público.
Source: National Transit Database.
Fluctuations in the levels of capital investment in different types of transit assets reflect normal rehabilitation and replacement cycles and new investment. Capital investment expenditures have been reported to the National Transit Database (NTD) only at the level of detail in Exhibit 2-27 since 2002. Prior to 2002 the data were not as detailed.
Total guideway investment was $6.4 billion in 2014, and total investment in systems was $1.7 billion. Guideway includes at-grade rail, elevated structures, tunnels, bridges, track, and power systems for all rail modes, as well as paved highway lanes dedicated to fixed-route buses. Investment in systems by transit operators includes groups of devices or objects forming a network, most notably for train control, signaling, and communications.
How does FTA fund major transit construction projects?
FTA provides funding for the design and construction of light rail, heavy rail, commuter rail, streetcar, bus rapid transit, and ferry projects through a discretionary grant program known as Capital Investment Grants. Title 49 U.S.C. Section 5309 provides funds for new transit systems, extensions to current systems, and capacity expansion projects on existing transit lines currently at or over capacity. These types of projects are known more commonly as “New Starts,” “Small Starts,” and “Core Capacity” projects.
To receive funds from the Capital Investment Grant program, the proposed project must emerge from the metropolitan or statewide planning process and proceed through a multiyear, multistep process outlined in law, which includes a detailed evaluation and rating of the project by FTA. FTA evaluates proposed projects based on financial criteria and project justification criteria as prescribed by statute.
Under current law, Capital Investment Grant funding may not exceed 80 percent of a project’s total capital cost. New Starts have a 51 percent limit for CIG funding (SS and CC are 80%)—with an 80 percent cap for total Federal contribution. Generally, however, the Capital Investment Grant program share of such projects averages about 50%, due to the overwhelming demand for funds nationwide. Funds are typically provided over a multiyear period rather than all at once, due to the size of the projects and the size of the overall annual program funding level.
Most, but not all, major transit capital projects are constructed using Capital Investment Grant program funds. Some project sponsors choose to use other sources instead, such as FTA Urbanized Area Formula funds, FTA discretionary Ferry Program funds, and other discretionary grant program funds from the Department of Transportation. In 2014, total investment in vehicles, stations, and maintenance facilities was $4.3 billion, $2.6 billion, and $1.1 billion, respectively. “Vehicles” include the bodies and chassis of transit vehicles and their attached fixtures and appliances, but do not include fare collection equipment and movement control equipment (such as radios) for revenue vehicles. “Stations” include station buildings, platforms, shelters, parking and other forms of access, and crime prevention and security equipment at stations. “Facilities” include the purchase, construction, and rehabilitation of administrative and maintenance facilities. Facilities also include investment in building structures, climate control, parking, yard track, vehicle and facilities maintenance equipment, furniture, office equipment, and computer systems.
“Other capital costs” include those associated with general administration facilities, furniture, equipment that is not an integral part of buildings and structures, data processing equipment, and shelters located at on-street bus stops. “Data processing equipment” includes computers and peripheral devices for which the sole use is in data processing operations.
Exhibit 2-28 shows yearly capital expenditures for rehabilitation or expansion by mode. Rehabilitation expenses are those dollars used to replace service directly or to maintain existing service. Expansion expenses are those used to increase service. Example expansion expenses include procuring additional buses to create a new route, building a new rail line, or constructing an additional rail station on an existing rail line.
Exhibit 2-28: Urban Capital Expenditures Applied by Rehabilitation or Expansion by Mode, 2004–2014
| Expenditures (Millions of Constant 2014 Dollars) | Average Annual Rate of Change 2014/2004 | |||||||||||
|---|---|---|---|---|---|---|---|---|---|---|---|---|
| 2004 | 2005 | 2006 | 2007 | 2008 | 2009 | 2010 | 2011 | 2012 | 2013 | 2014 | ||
| Rail Rehabilitation | $7,595 | $7,256 | $7,173 | $7,572 | $8,496 | $8,256 | $6,744 | $6,156 | $5,697 | $6,868 | $6,721 | -1.2% |
| Rail Expansion | $3,471 | $2,963 | $3,655 | $3,986 | $4,957 | $5,579 | $6,205 | $5,428 | $6,806 | $5,944 | $6,053 | 5.7% |
| Rail Total | $11,066 | $10,219 | $10,828 | $11,557 | $13,453 | $13,835 | $12,948 | $11,584 | $12,504 | $12,812 | $12,774 | 1.4% |
| Nonrail Rehabilitation | $4,225 | $3,606 | $3,622 | $3,353 | $3,556 | $4,239 | $4,487 | $4,309 | $4,288 | $4,077 | $4,272 | 0.1% |
| Nonrail Expansion | $528 | $507 | $417 | $580 | $618 | $497 | $547 | $567 | $561 | $532 | $345 | -4.2% |
| Nonrail Total | $4,752 | $4,113 | $4,039 | $3,933 | $4,174 | $4,736 | $5,034 | $4,875 | $4,849 | $4,610 | $4,617 | -0.3% |
| Rehabilitation Total | $11,820 | $10,862 | $10,795 | $10,925 | $12,052 | $12,494 | $11,231 | $10,465 | $9,985 | $10,945 | $10,993 | -0.7% |
| Expansion Total | $3,998 | $3,470 | $4,072 | $4,565 | $5,575 | $6,077 | $6,751 | $5,994 | $7,367 | $6,476 | $6,398 | 4.8% |
| Grand Total | $15,818 | $14,332 | $14,867 | $15,490 | $17,627 | $18,571 | $17,983 | $16,459 | $17,353 | $17,421 | $17,391 | 1.0% |
Source: National Transit Database.
After adjusting for inflation (constant dollars), total capital expenditures from 2004 to 2014 increased by an annual average of 1.0 percent. Although rehabilitation expenses over this period have decreased slightly, service expansion investment, particularly in rail modes, increased considerably. Expenses for rail expansion had the largest increase over this time, with an average annual of 5.7 percent.
Operating Expenditures
Transit operating expenditures include wages, salaries, fuel, spare parts, preventive maintenance, support services, and certain leases used in providing transit service. As indicated in Exhibit 2-29, $47.5 billion was available for operating expenses in 2014, the Federal share of which increased from the 2004 level of 8.2 percent to 8.7 percent in 2014. The largest share of Federal funds applied to operating expenditures comes from the Urbanized Area Formula Program (Title 49 U.S.C. Section 5307), which contributed 62 percent of all Federal funds. This program includes operating assistance for urbanized areas with populations less than 200,000, systems with fewer than 100 vehicles in urbanized areas (UZAs) with populations over 200,000, and capital funds eligible for operating assistance, such as preventive maintenance. Funds for the Rural Program (Title 49 U.S.C. Section 5311) contributed 13 percent, and funds from the State of Good Repair Program (Title 49 U.S.C. Section 5337), 9 percent. The remaining 15 percent included FTA, Department of Transportation, and other Federal funds. The share generated from system revenues decreased from 40.9 percent in 2004 to 35.5 percent in 2014. The State share increased from 21.9 percent in 2004 to 25.4 percent in 2014. The local share of operating expenditures increased marginally from 29.0 percent in 2004 to 30.4 percent in 2014.
Exhibit 2-29: Sources of Funds for Transit Operating Expenditures, 2004–20141
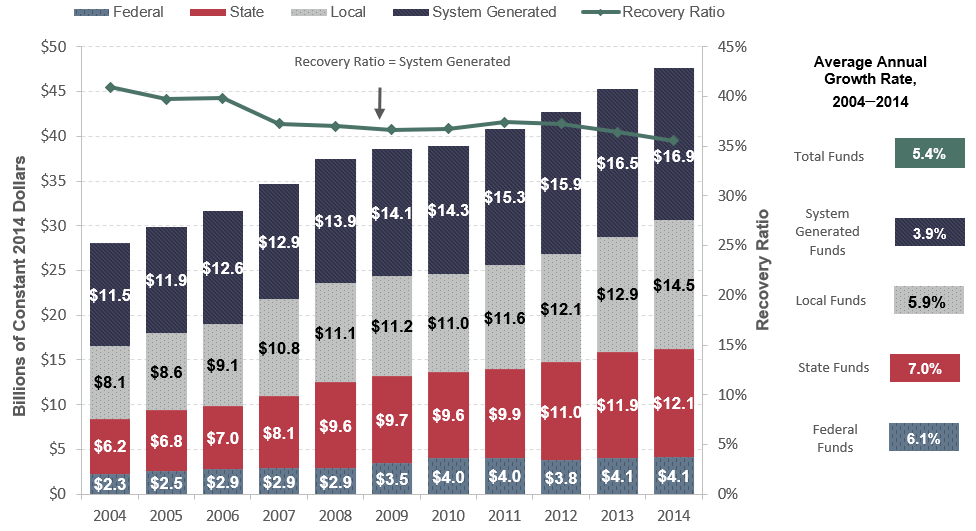
1Data prior to 2007 do not include rural expenditures.
Source: Transit Economic Requirements Model (TERM) and National Transit Database.
Operating Expenditures by Type of Cost
Exhibits 2-30 and 2-31 illustrate how nonrail (e.g., bus) and rail transit operations have inherently different cost structures because, in most cases, roads used by nonrail transit operators are not maintained by the transit provider, but tracks are. A significantly higher percentage of expenditures for rail modes of transportation is classified as nonvehicle maintenance, corresponding to the repair and maintenance costs of fixed guideway systems.
Exhibit 2-30: Rail Operating Expenditures by Type of Cost
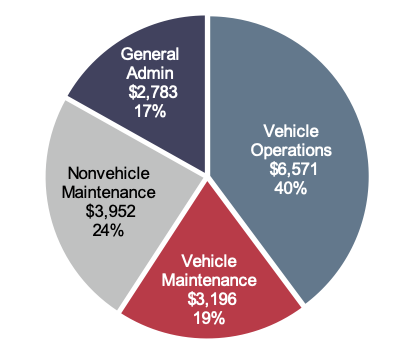
Note: Expenditures in millions of dollars
Source: National Transit Database
Exhibit 2-31: Nonrail Operating Expenditures by Type of Cost, 2014
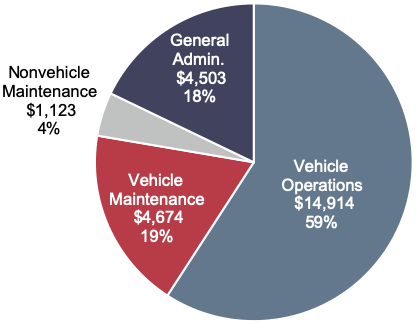
Note: Does not include rural agencies and agencies operating fewer than 30 peak vehicles.
Note: Expenditures in millions of dollars
Source: National Transit Database
Operating Expenditures per Vehicle Revenue Mile
Exhibit 2-33 shows labor financial indicators for two groups of aggregate data: Top 10 agencies (by ridership) as of 2014, and the national total of all urban agencies in the United States. Total fares per vehicle revenue mile for the top 10 agencies combined are approximately 60 percent greater than the total for all other agencies combined. The recovery ratios for both the top 10 and the national total decreased between 2004 and 2014, as the fare per revenue mile ratios increased at a lower average rate than the cost per revenue mile.
Ridership grew at a rate greater than the rate of increase in service miles or operating expenses over the 10 year period. As cost and service effectiveness of these agencies grew, farebox revenues increased roughly in the same proportion, resulting in recovery ratios greater than the national average. As shown in Exhibit 2-34, analysis of the NTD reports for the top 10 transit agencies ranked by population shows that the growth in operating expenses is led by the cost of fringe benefits, which have been increasing at a rate of 1.3 percent per year above inflation (constant dollars) since 2004. By comparison, average salaries at these 10 agencies decreased at an inflation-adjusted rate of 0.8 percent per year in that period. FTA does not collect data on the different components of fringe benefits, but increases in the cost of medical insurance typically drive growth rates in fringe benefits across the economy and likely drive the growth in this category.
Efficiency, Cost Effectiveness, and Service Effectiveness
Cost Efficiency is the relationship between cost inputs such as labor, fuel, capital, etc. to service outputs such as vehicle miles and hours. Common metrics include labor expenses per hour, and materials and services per mile.
Cost Effectiveness is the relationship between cost inputs to service consumption, such as linked trips (number of boardings) and unlinked trips (one trip from origin to destination regardless of how many modes were used), and passenger miles. Common metrics are operating cost per trip and per passenger mile.
Service Effectiveness links service outputs to service consumption. Common metrics are trips per hour, passenger miles per revenue mile (load factor), etc.
Exhibit 2-32: Urban Operating Expenditures per Vehicle Revenue Mile, 2004–2014
| Mode | Expenditures (Millions of Constant 2014 Dollars) | Total | |||||
|---|---|---|---|---|---|---|---|
| Heavy Rail | Commuter Rail | Light Rail1 | Fixed-Route Bus2 | Demand Response3 | Other4 | ||
| 2004 | $9.50 | $16.04 | $16.69 | $9.50 | $4.69 | $5.81 | $9.22 |
| 2005 | $9.92 | $16.00 | $17.43 | $9.70 | $4.69 | $5.50 | $9.37 |
| 2006 | $9.80 | $15.42 | $17.21 | $9.85 | $4.84 | $4.58 | $9.37 |
| 2007 | $10.53 | $15.41 | $16.12 | $10.01 | $4.60 | $5.83 | $9.54 |
| 2008 | $10.28 | $15.29 | $16.03 | $10.16 | $4.58 | $5.41 | $9.49 |
| 2009 | $10.44 | $16.05 | $17.44 | $10.33 | $4.66 | $5.05 | $9.63 |
| 2010 | $10.68 | $15.90 | $18.04 | $10.48 | $4.80 | $4.91 | $9.76 |
| 2011 | $11.03 | $15.84 | $17.67 | $10.41 | $4.57 | $4.64 | $9.65 |
| 2012 | $11.28 | $16.04 | $17.84 | $10.44 | $4.57 | $4.73 | $9.72 |
| 2013 | $12.69 | $16.47 | $17.46 | $10.50 | $4.48 | $4.60 | $9.97 |
| 2014 | $13.16 | $16.76 | $18.02 | $10.61 | $4.43 | $4.58 | $10.11 |
| Average Annual Rate of Change 2014/2004 | 3.3% | 0.4% | 0.8% | 1.1% | -0.6% | -2.4% | 0.9% |
1 Includes light rail, hybrid rail, and streetcar rail.
2 Includes bus, bus rapid transit, and commuter bus.
3 Includes demand response and demand response taxi.
4 Includes aerial tramway, Alaska railroad, cable car, ferryboat, inclined plane, monorail/automated guideway, público, trolleybus, and vanpool.
Note: annual changes in operating expense per capacity-equivalent VRM and unadjusted motor bus operating expenditures are consistent with those shown in Exhibit 2-32.
Source: National Transit Database.
Exhibit 2-33: Top 10 vs All Other Urban Agencies in the United States1
| Report Year | 2004 | 2005 | 2006 | 2007 | 2008 | 2009 | 2010 | 2011 | 2012 | 2013 | 2014 | Average Annual Change | Change 2004–2014 |
|---|---|---|---|---|---|---|---|---|---|---|---|---|---|
| Top 10 Fares per VRM | $5.2 | $5.1 | $5.2 | $5.2 | $5.2 | $5.2 | $5.4 | $5.8 | $5.9 | $6.1 | $6.1 | 1.5% | 17.9% |
| Top 10 Cost per VRM | $11.5 | $11.7 | $11.9 | $12.3 | $12.0 | $12.2 | $12.4 | $12.7 | $13.0 | $13.9 | $14.2 | 1.9% | 23.3% |
| Top 10 Recovery Ratio | 45.0% | 43.9% | 44.0% | 41.9% | 43.0% | 42.4% | 43.2% | 46.0% | 45.0% | 44.0% | 43.0% | -0.4% | -4.4% |
| National Fares per VRM | $3.3 | $3.2 | $3.3 | $3.0 | $3.0 | $3.0 | $3.1 | $3.2 | $3.3 | $3.4 | $3.3 | 0.1% | 1.6% |
| National Cost per VRM | $7.2 | $7.6 | $7.9 | $7.6 | $7.9 | $8.0 | $8.2 | $8.4 | $8.7 | $9.2 | $9.4 | 2.5% | 31.9% |
| National Recovery Ratio | 36.2% | 35.3% | 36.1% | 34.0% | 34.2% | 34.3% | 34.7% | 36.7% | 36.6% | 36.5% | 35.0% | -0.3% | -3.4% |
1 Recovery Ratio calculation and cost per mile include only mode expenses. They do not include reconciling cash expenditures.
Source: National Transit Database.
Exhibit 2-34: Urban Growth in Labor Costs—Largest 10 Agencies, 2004–20141
| Average Cost per Vehicle Mile (Constant 2014 Dollars) | % Growth Since 2004 | Average Annual Rate of Change |
|||||||||||
|---|---|---|---|---|---|---|---|---|---|---|---|---|---|
| Cost Component | 2004 | 2005 | 2006 | 2007 | 2008 | 2009 | 2010 | 2011 | 2012 | 2013 | 2014 | ||
| Salaries | $5.6 | $5.4 | $5.5 | $5.5 | $5.1 | $5.2 | $5.2 | $5.3 | $5.2 | $5.0 | $5.2 | -7.4% | -0.8% |
| Fringe Benefits | $3.7 | $3.8 | $3.8 | $4.1 | $3.6 | $3.8 | $4.0 | $4.2 | $4.3 | $4.0 | $4.2 | 13.3% | 1.3% |
| Total Labor Cost | $9.3 | $9.2 | $9.3 | $9.6 | $8.8 | $9.0 | $9.2 | $9.5 | $9.4 | $9.0 | $9.3 | 0.9% | 0.1% |
1 Metropolitan Transportation Authority New York City, Chicago Transit Authority, Los Angeles County Metropolitan Transportation Authority, Washington Metropolitan Area Transit Authority, Massachusetts Bay Transportation Authority, Southeastern Pennsylvania Transportation Authority, New Jersey Transit Corporation, San Francisco Municipal Railway, Metropolitan Atlanta Rapid Transit Authority, and Maryland Transit Administration.
Note: Labor costs data are available only for a subset of agencies, and thus no national totals are included.
Source: National Transit Database.
Average Fares and Operating Costs, on a Per Mile Basis, for the Nation’s 10 Largest Transit Agencies
After adjusting for inflation, fares per mile have increased by 1.7 percent from 2004 to 2014, while the average cost per mile has increased by 1.6 percent. The result is a 0.1 percent increase in the “fare recovery ratio,” which is the percentage of operating costs that passenger fares cover. The 2014 average fare recovery ratio of these 10 agencies, which are all rail, was 32.7 percent. These agencies are more cost and service effective than the national average, which means that ridership grows at a rate greater than the rate of increase in service miles or operating expenses.
Operating expenditures per capacity-equivalent VRM are a better measure of comparing cost efficiency among modes than operating expenditures per VRM, because the former measure adjusts for passenger-carrying capacities. As illustrated in Exhibit 2-35, rail systems are more cost-efficient in providing service than are nonrail systems, once investment in rail infrastructure has been completed (indeed, this is one of the explicit tradeoffs that agencies consider when deciding whether to construct or expand an urban rail system). Based on operating costs alone, heavy rail is the most efficient at providing transit service, and demand-response systems are the least efficient.
Exhibit 2-35: Transit Operating Expenditures per Capacity-Equivalent Vehicle Revenue Mile by Mode, 2004–2014
| Mode | Expenditures (Constant 2014 Dollars) | Total | |||||
|---|---|---|---|---|---|---|---|
| Heavy Rail | Commuter Rail | Light Rail1 | Fixed-Route Bus2 | Demand Response3 | Other4 | ||
| 2004 | $3.83 | $6.27 | $6.20 | $9.14 | $22.59 | $10.03 | $7.08 |
| 2005 | $4.00 | $6.01 | $6.18 | $9.43 | $22.84 | $10.41 | $7.23 |
| 2006 | $3.90 | $5.69 | $6.24 | $9.71 | $23.75 | $9.75 | $7.25 |
| 2007 | $4.23 | $5.60 | $5.85 | $9.59 | $19.38 | $11.37 | $7.33 |
| 2008 | $4.16 | $5.59 | $5.89 | $9.76 | $19.84 | $12.50 | $7.41 |
| 2009 | $4.21 | $5.83 | $6.26 | $9.91 | $20.41 | $12.54 | $7.56 |
| 2010 | $4.33 | $5.80 | $6.46 | $10.02 | $19.53 | $12.15 | $7.65 |
| 2011 | $4.46 | $5.76 | $5.98 | $9.95 | $20.19 | $11.29 | $7.65 |
| 2012 | $4.56 | $5.73 | $6.12 | $10.07 | $19.65 | $11.94 | $7.72 |
| 2013 | $5.47 | $5.78 | $5.77 | $10.21 | $19.55 | $12.04 | $8.07 |
| 2014 | $5.47 | $5.68 | $5.72 | $10.41 | $21.10 | $11.88 | $8.20 |
|
Average Annual Rate of Change 2014/2004 |
3.6% | -1.0% | -0.8% | 1.3% | -0.7% | 1.7% | 1.5% |
1 Includes light rail, hybrid rail, and streetcar rail.
2 Includes bus, bus rapid transit, and commuter bus.
3 Includes demand response and demand response taxi.
4 Includes aerial tramway, Alaska railroad, cable car, ferryboat, inclined plane, monorail/automated guideway, público, trolleybus, and vanpool.
Source: National Transit Database.
Operating Expenditures per Passenger Mile
Operating expense per passenger mile is an indicator of the cost-effectiveness of providing a transit service. It shows the relationship between service inputs as expressed by operating expenses and service consumption as measured in passenger miles traveled. Operating expenditures per passenger mile for all transit modes combined increased at an average annual rate of 0.4 percent between 2004 and 2014 when adjusted for constant dollars (from $0.70 to $0.73). These data are shown in Exhibit 2-36.
Exhibit 2-36: Urban Operating Expenditures per Passenger Mile, 2004–2014
| Mode | Expenditures (Constant 2014 Dollars) | Total | |||||
|---|---|---|---|---|---|---|---|
| Heavy Rail | Commuter Rail | Light Rail1 | Fixed-Route Bus2 | Demand Response3 | Other4 | ||
| 2004 | $0.41 | $0.44 | $0.71 | $0.95 | $3.74 | $0.65 | $0.70 |
| 2005 | $0.43 | $0.47 | $0.70 | $0.94 | $3.74 | $0.62 | $0.72 |
| 2006 | $0.42 | $0.43 | $0.67 | $0.92 | $3.90 | $0.59 | $0.70 |
| 2007 | $0.42 | $0.41 | $0.69 | $0.95 | $3.81 | $0.68 | $0.69 |
| 2008 | $0.40 | $0.43 | $0.66 | $0.94 | $3.73 | $0.63 | $0.69 |
| 2009 | $0.41 | $0.45 | $0.71 | $0.96 | $3.83 | $0.64 | $0.71 |
| 2010 | $0.42 | $0.46 | $0.76 | $0.98 | $3.94 | $0.62 | $0.73 |
| 2011 | $0.41 | $0.44 | $0.71 | $0.96 | $3.85 | $0.60 | $0.70 |
| 2012 | $0.41 | $0.46 | $0.71 | $0.93 | $3.91 | $0.60 | $0.70 |
| 2013 | $0.46 | $0.46 | $0.73 | $0.94 | $3.95 | $0.59 | $0.71 |
| 2014 | $0.47 | $0.49 | $0.75 | $0.96 | $3.93 | $0.59 | $0.73 |
|
Average Annual Rate of Change 2014/2004 |
1.3% | 1.0% | 0.6% | 0.2% | 0.5% | -0.9% | 0.4% |
1 Includes light rail, hybrid rail, and streetcar rail.
2 Includes bus, bus rapid transit, and commuter bus.
3 Includes demand response and demand response taxi.
4 Includes aerial tramway, Alaska railroad, cable car, ferryboat, inclined plane, monorail/automated guideway, público, trolleybus, and vanpool.
Note: Does not include rural agencies because they do not report passenger miles to the NTD.
Source: National Transit Database.
Farebox Recovery Ratios
The farebox recovery ratio represents farebox revenues as a percentage of total transit operating costs net of reconciling cash expenses. Reconciling items are expense items where accounting practices vary as a result of local ordinances and conditions. The most common expenses under reconciling items are depreciation and amortization, interest payments and leases and rentals. It measures users’ contributions to the variable cost of providing transit services and is influenced by the number of riders, fare structure, rider profile, and the transit agency’s ability to effectively control operating expenses.. Low regular fares, high availability and use of discounted fares, high transfer rates, and relatively higher operating expenses tend to result in lower farebox recovery ratios. Farebox recovery ratios for 2004 to 2014 are provided in Exhibit 2-37. The average farebox recovery ratio over this period for all transit modes combined was 35.8 percent in 2014. Heavy rail had the highest average farebox recovery ratio in 2014 at 59.3 percent. Farebox recovery ratios for total costs are not provided because capital investment costs are not evenly distributed across years. Rail modes have farebox recovery ratios for total costs that are significantly lower than for operating costs alone because of these modes’ high level of capital costs.
Exhibit 2-37: Urban Farebox Recovery Ratio of Operating Costs by Mode, 2004–2014
1Includes light rail, hybrid rail, and streetcar rail.
2 Includes bus, bus rapid transit,and commuter bus.
| Mode | Heavy Rail | Commuter Rail | Light Rail1 | Fixed-Route Bus2 | Demand Response3 | Other4 | Total |
|---|---|---|---|---|---|---|---|
| 2004 | 61.3% | 47.0% | 26.2% | 29.1% | 10.4% | 37.3% | 36.3% |
| 2005 | 58.4% | 47.3% | 25.4% | 28.4% | 10.4% | 36.2% | 35.3% |
| 2006 | 60.9% | 49.5% | 27.4% | 28.6% | 10.1% | 40.3% | 36.0% |
| 2007 | 56.8% | 49.5% | 26.6% | 26.6% | 8.6% | 35.9% | 34.0% |
| 2008 | 59.4% | 50.3% | 29.3% | 26.3% | 7.5% | 32.9% | 34.2% |
| 2009 | 60.2% | 48.0% | 28.2% | 26.7% | 7.8% | 35.4% | 34.3% |
| 2010 | 62.3% | 48.6% | 28.1% | 26.8% | 8.0% | 37.2% | 34.7% |
| 2011 | 66.0% | 52.1% | 29.7% | 28.0% | 7.4% | 38.0% | 36.7% |
| 2012 | 64.6% | 51.8% | 29.0% | 28.2% | 7.7% | 40.1% | 36.6% |
| 2013 | 60.5% | 50.8% | 30.7% | 28.5% | 7.8% | 40.4% | 36.6% |
| 2014 | 59.3% | 50.1% | 28.2% | 27.7% | 7.6% | 40.4% | 35.8% |
| Average Annual Rate of Change 2014/2004 |
-0.3% | 0.6% | 0.7% | -0.5% | -3.2% | 0.8% | -0.1% |
3Includes demand response and demand response taxi.
4 Includes aerial tramway, Alaska railroad, cable car, ferryboat, inclined plane, monorail/automated guideway, público, trolleybus, and vanpool.
Source: National Transit Database.